
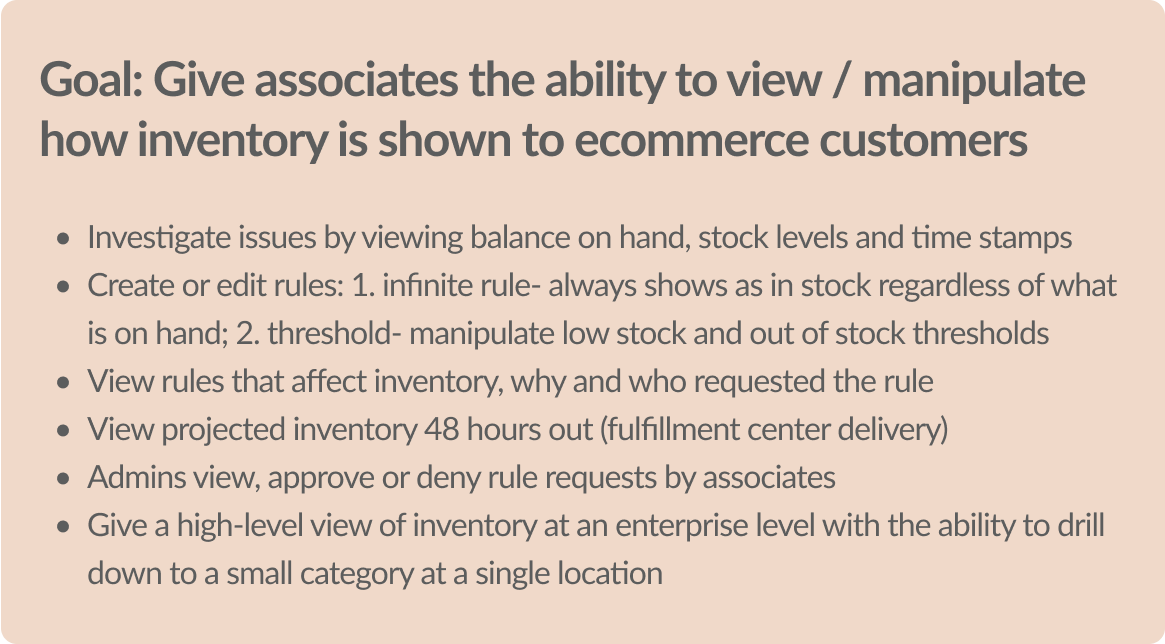
What’s out of stock at Kroger?
Client: Kroger product teams
Role: Senior product designer
Collaborated with product managers, software engineers, merchandising and retail-ops
Background
Inventory Insights started as a technical “Inventory Admin Tool” built by engineers, used only to view and document rules. It lacked the Kroger design system, was difficult to use, and limited to engineers and later PMs.
When I joined, I redesigned the tool to expand its value and audience. I introduced UX standards, guided a backend-focused team in building a usable frontend, and streamlined workflows. Previously, engineers and PMs spent hours fielding questions and handling rule changes through ad hoc communication—my work laid the foundation for a scalable, user-friendly application.
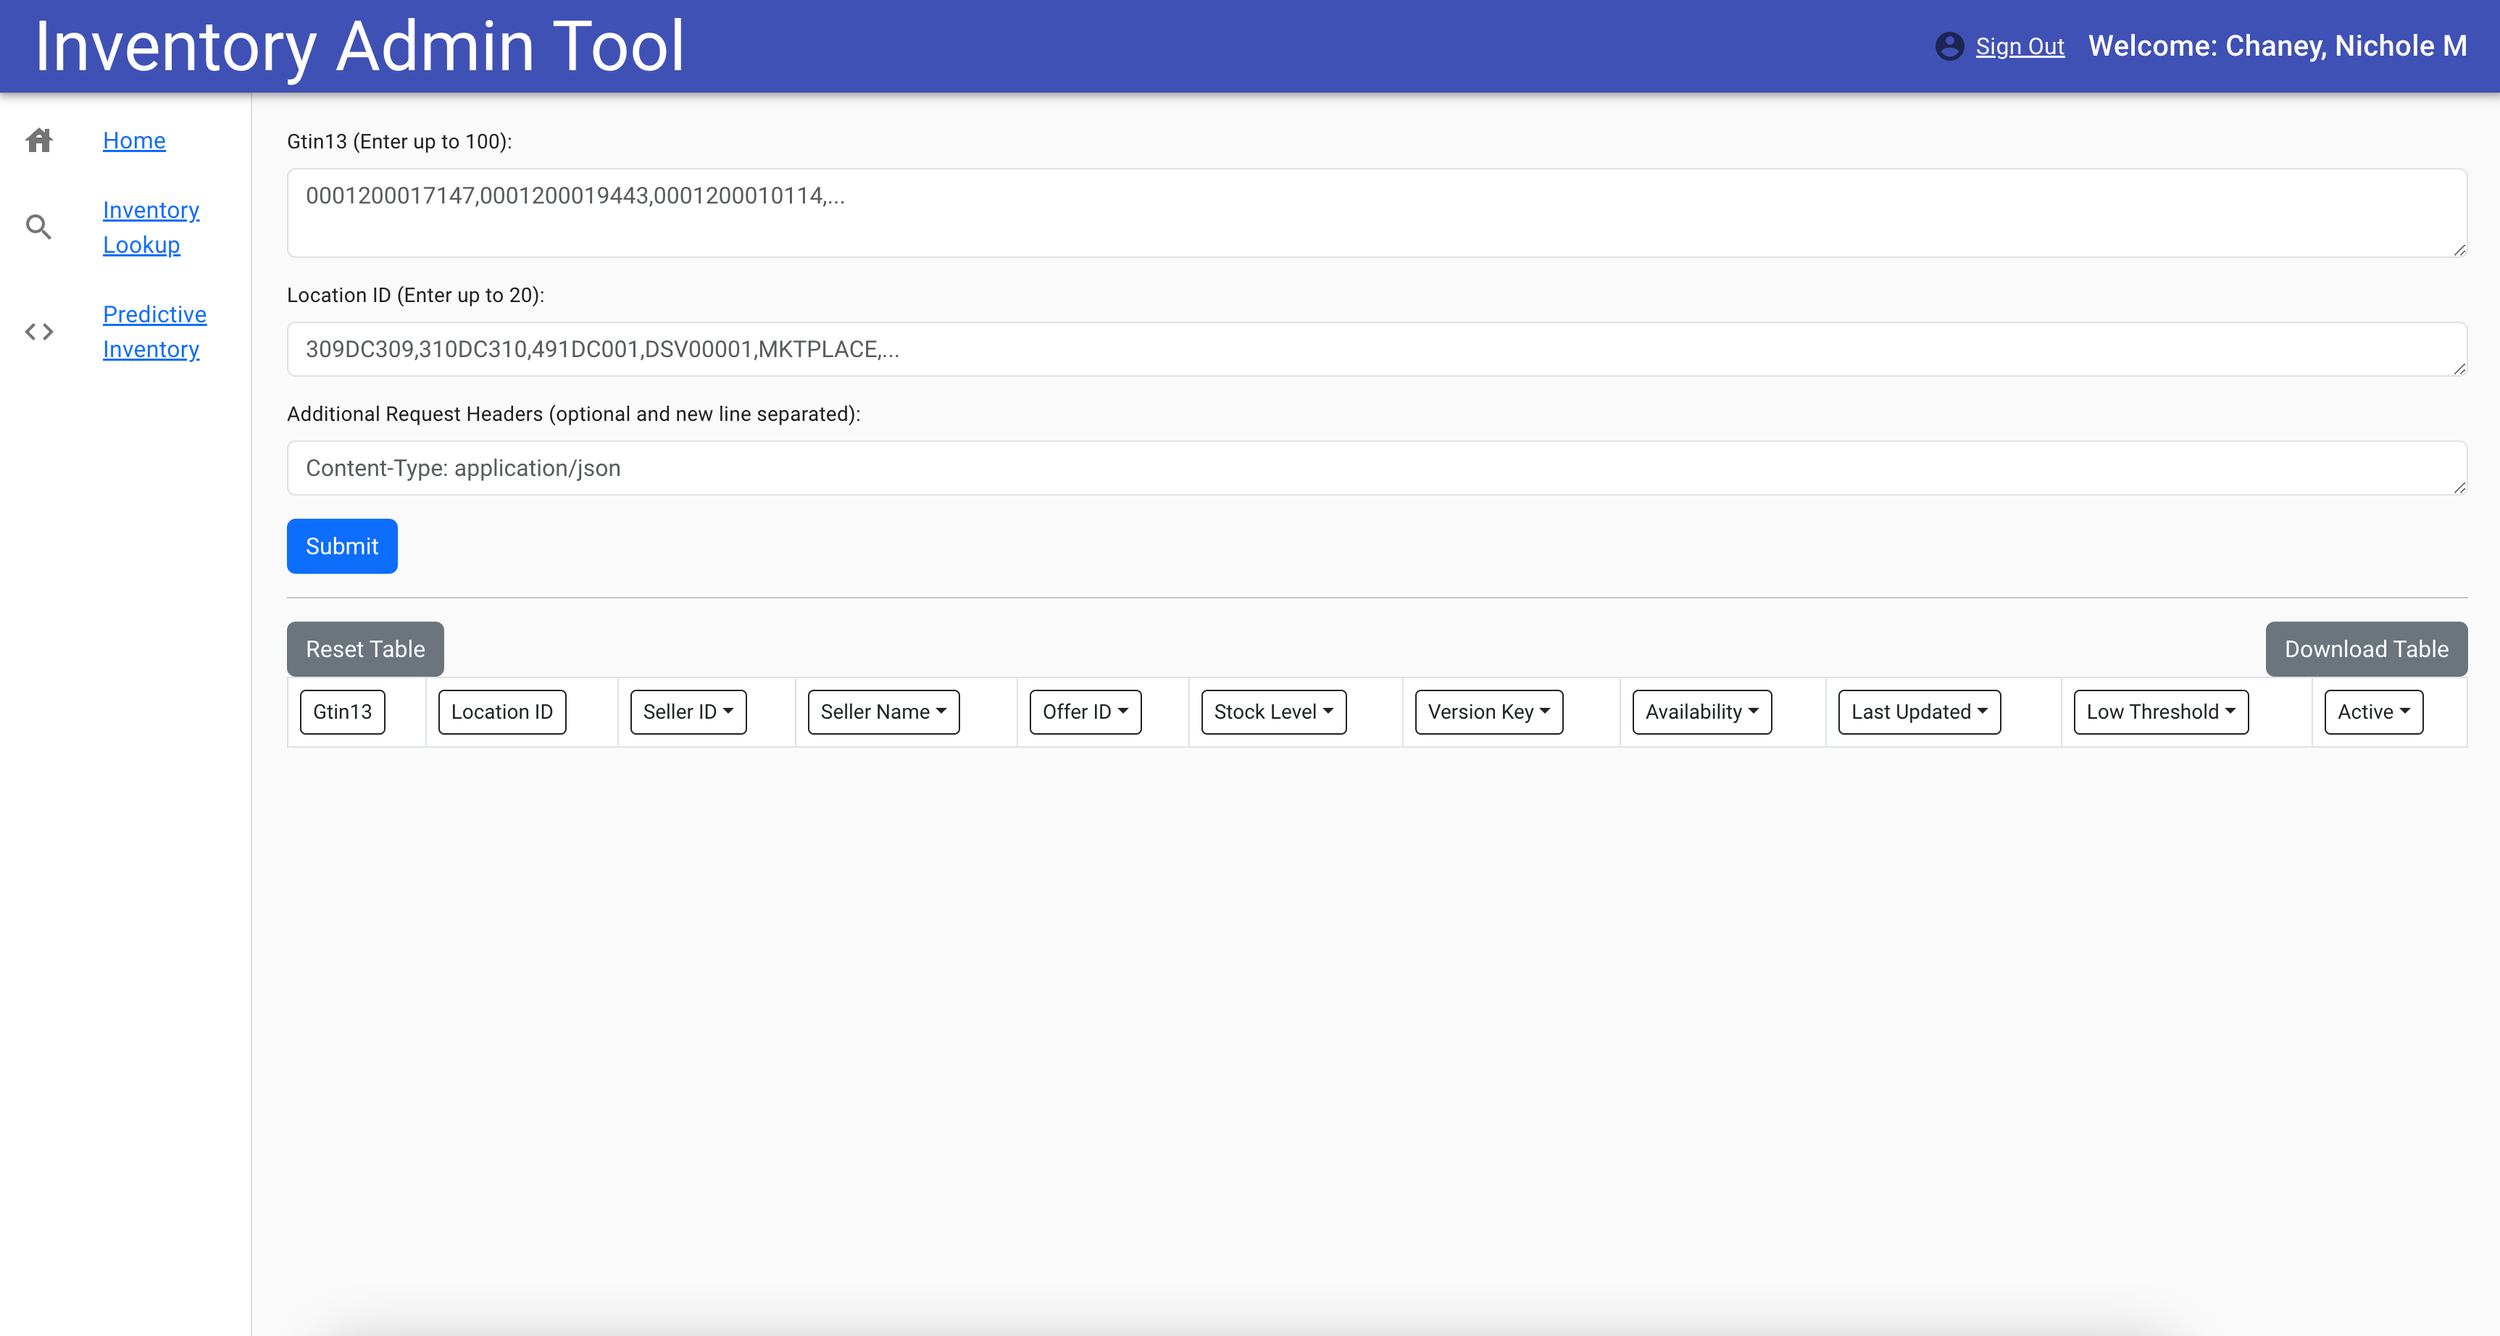
Old Inventory Admin Tool created by engineers
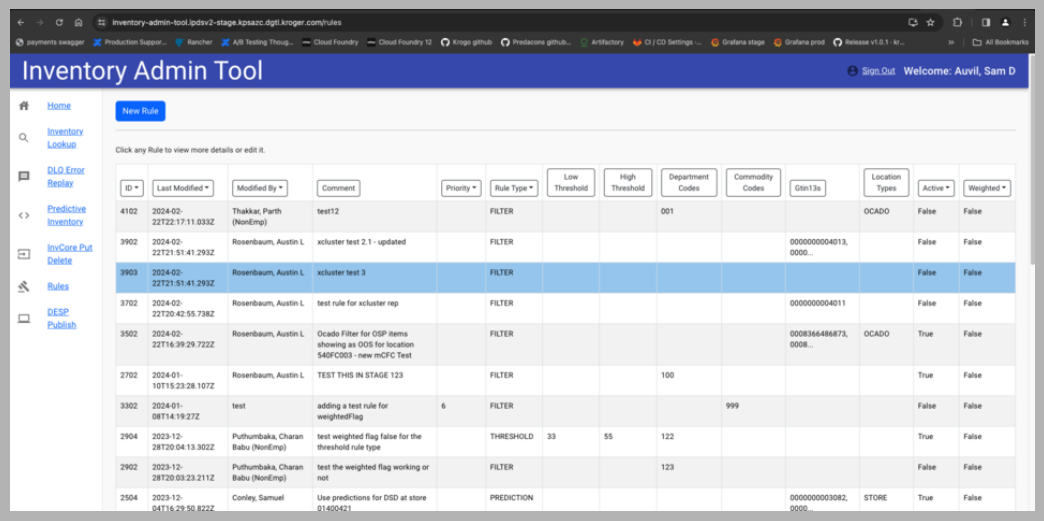
Old Inventory Admin Tool created by engineers
MVP
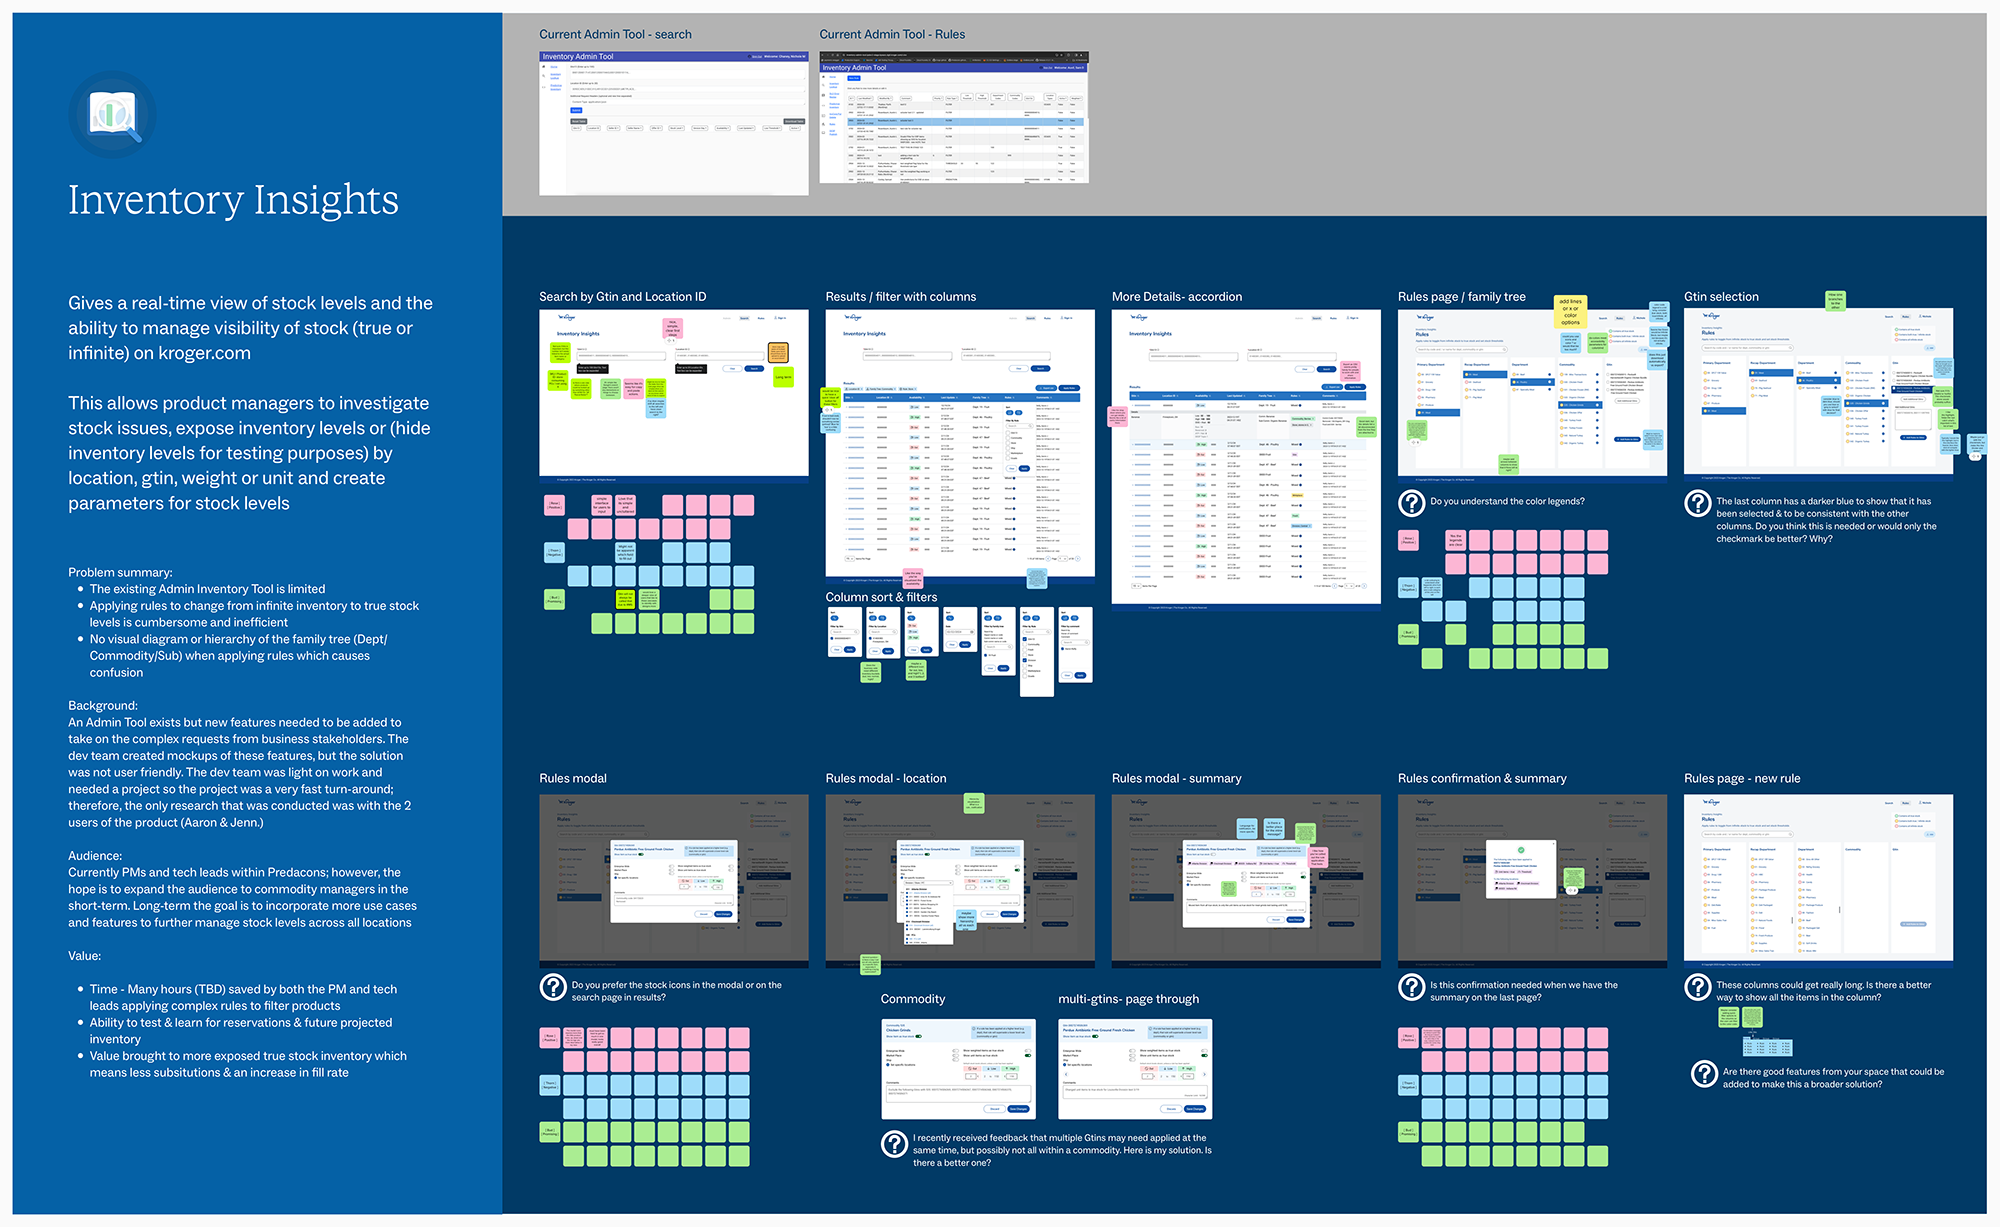
The admin tool was already in progress and new features needed to be developed as soon as possible. There wasn’t time for robust research before the revised site was created. Therefore, I did informal interviews of the engineers and product managers currently using the admin tool to understand their needs. I also relied on secondary research and my skills as a user experience designer to create the first few pages of the tool.
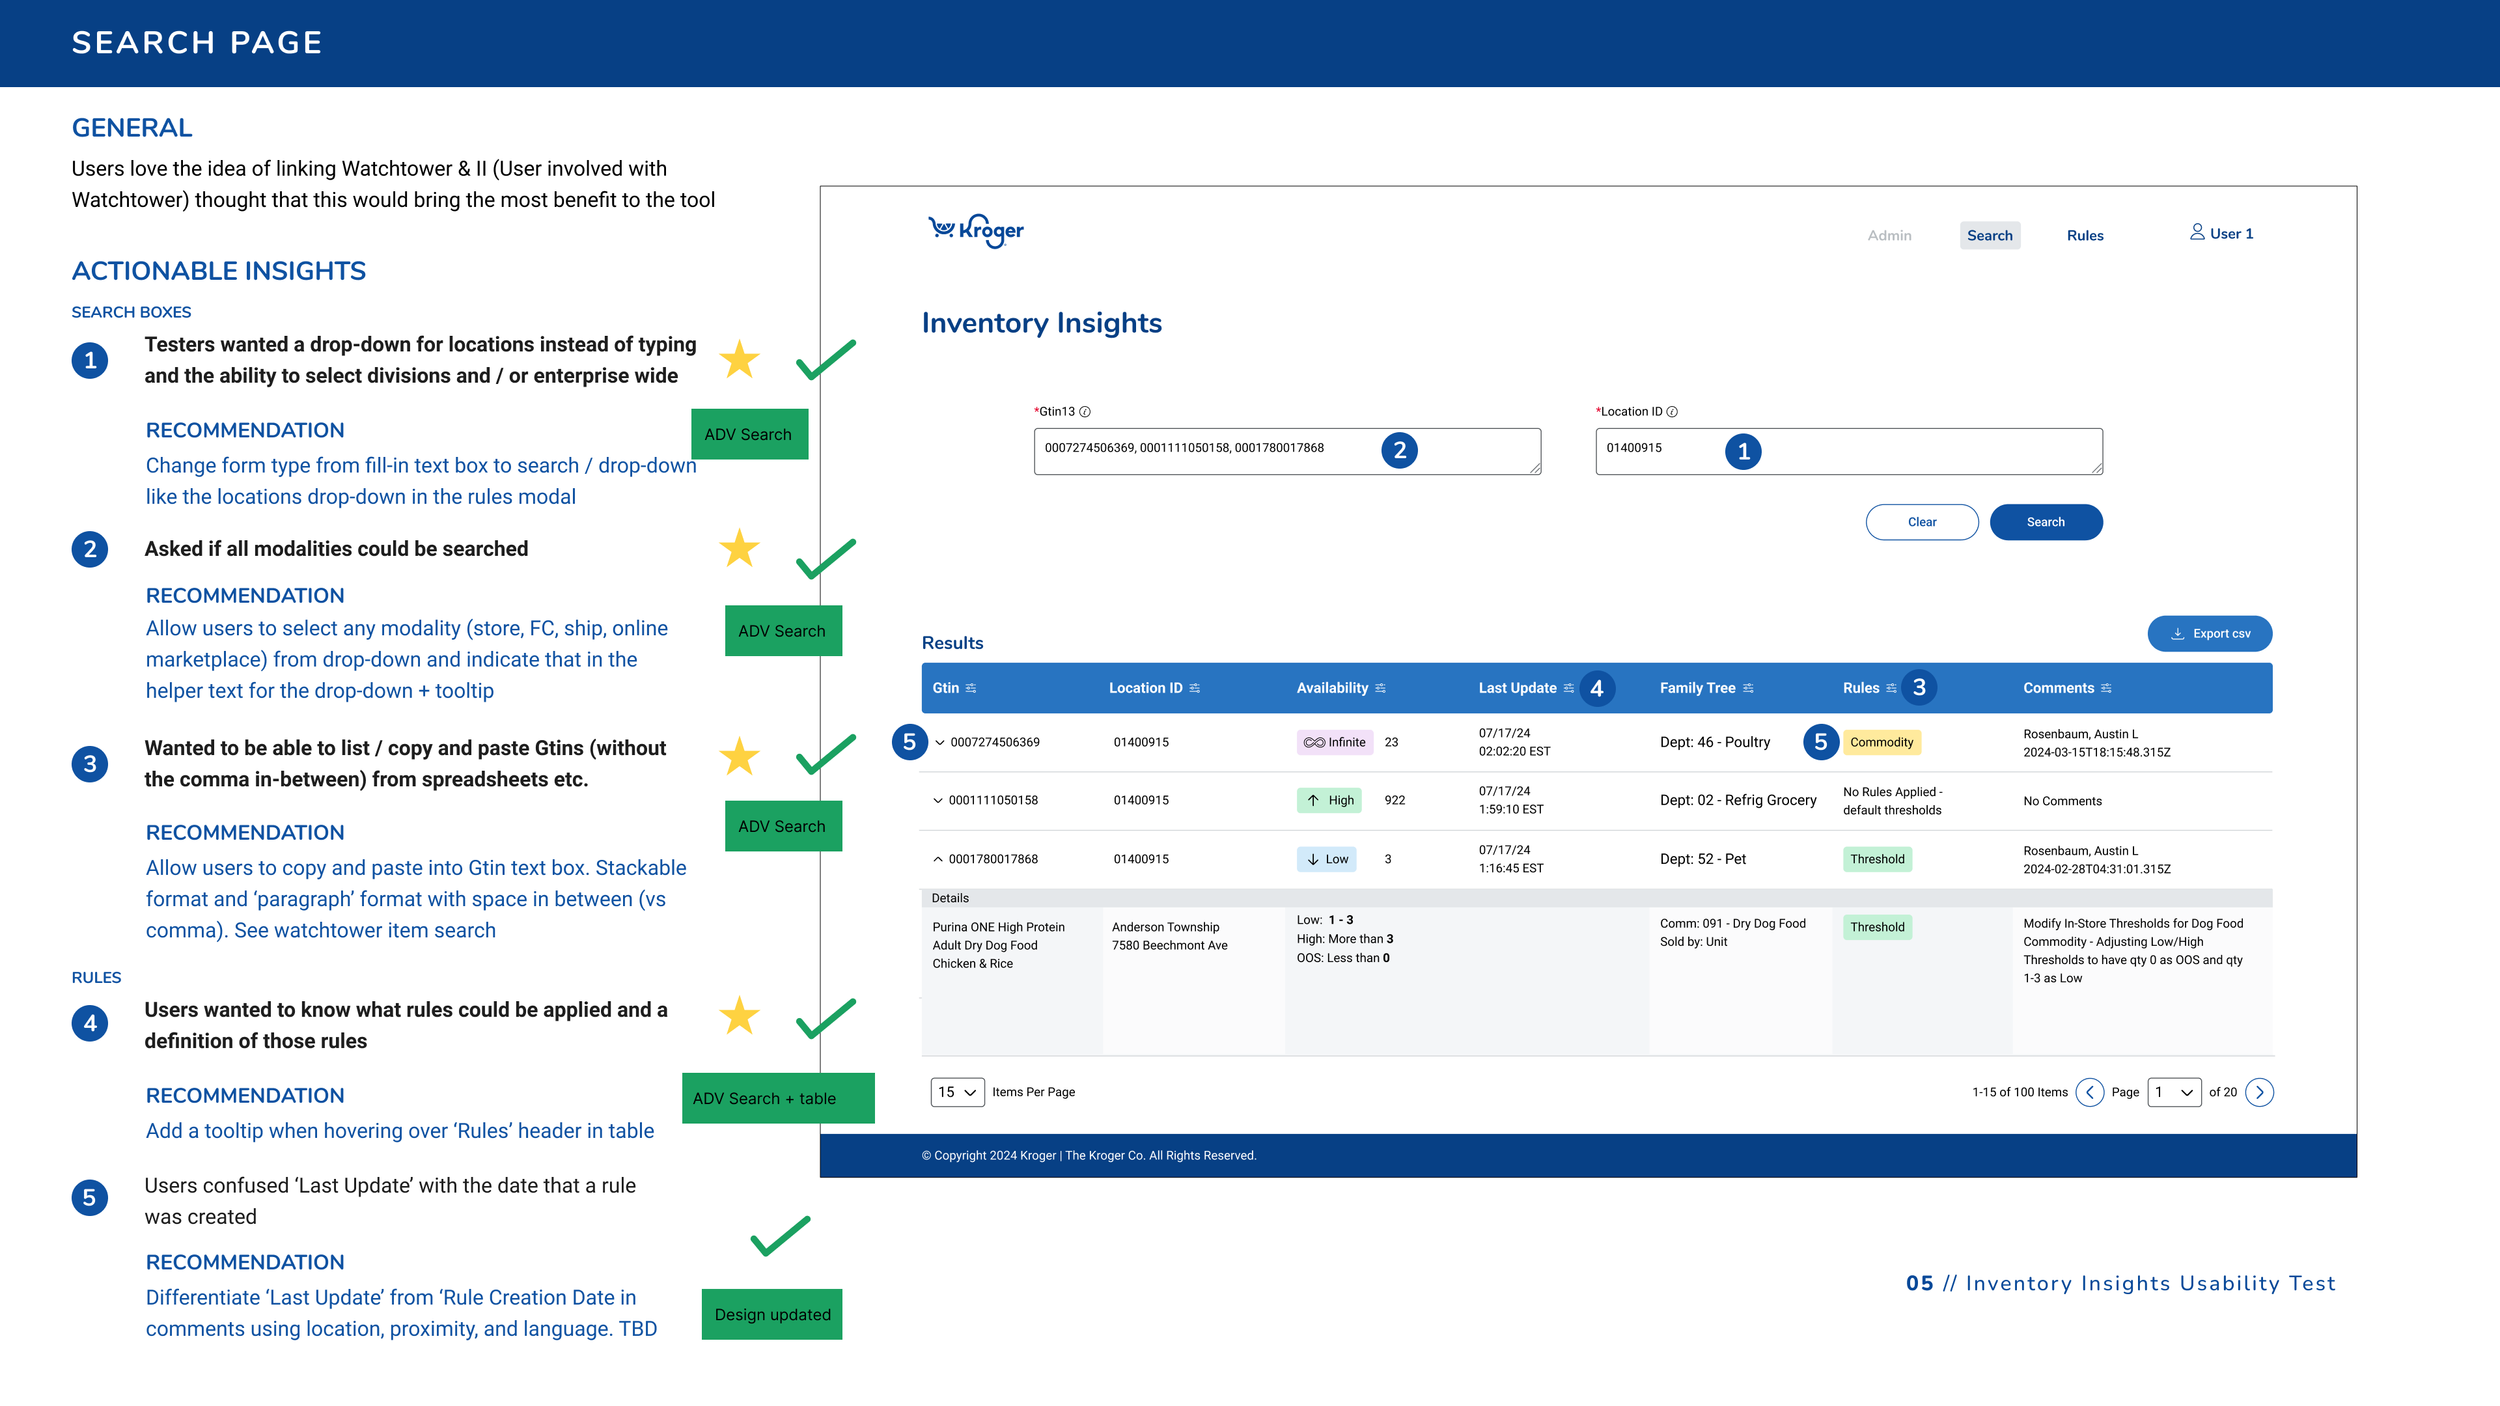
Search Page
The search page allows users to search by product number (UPC or GTIN) and location. The results show the availability (stock status and balance on hand), timestamp of last update, and rule / rule description. The drop-down gives more detailed information (not shown here- see beyond MVP for what this looks like).

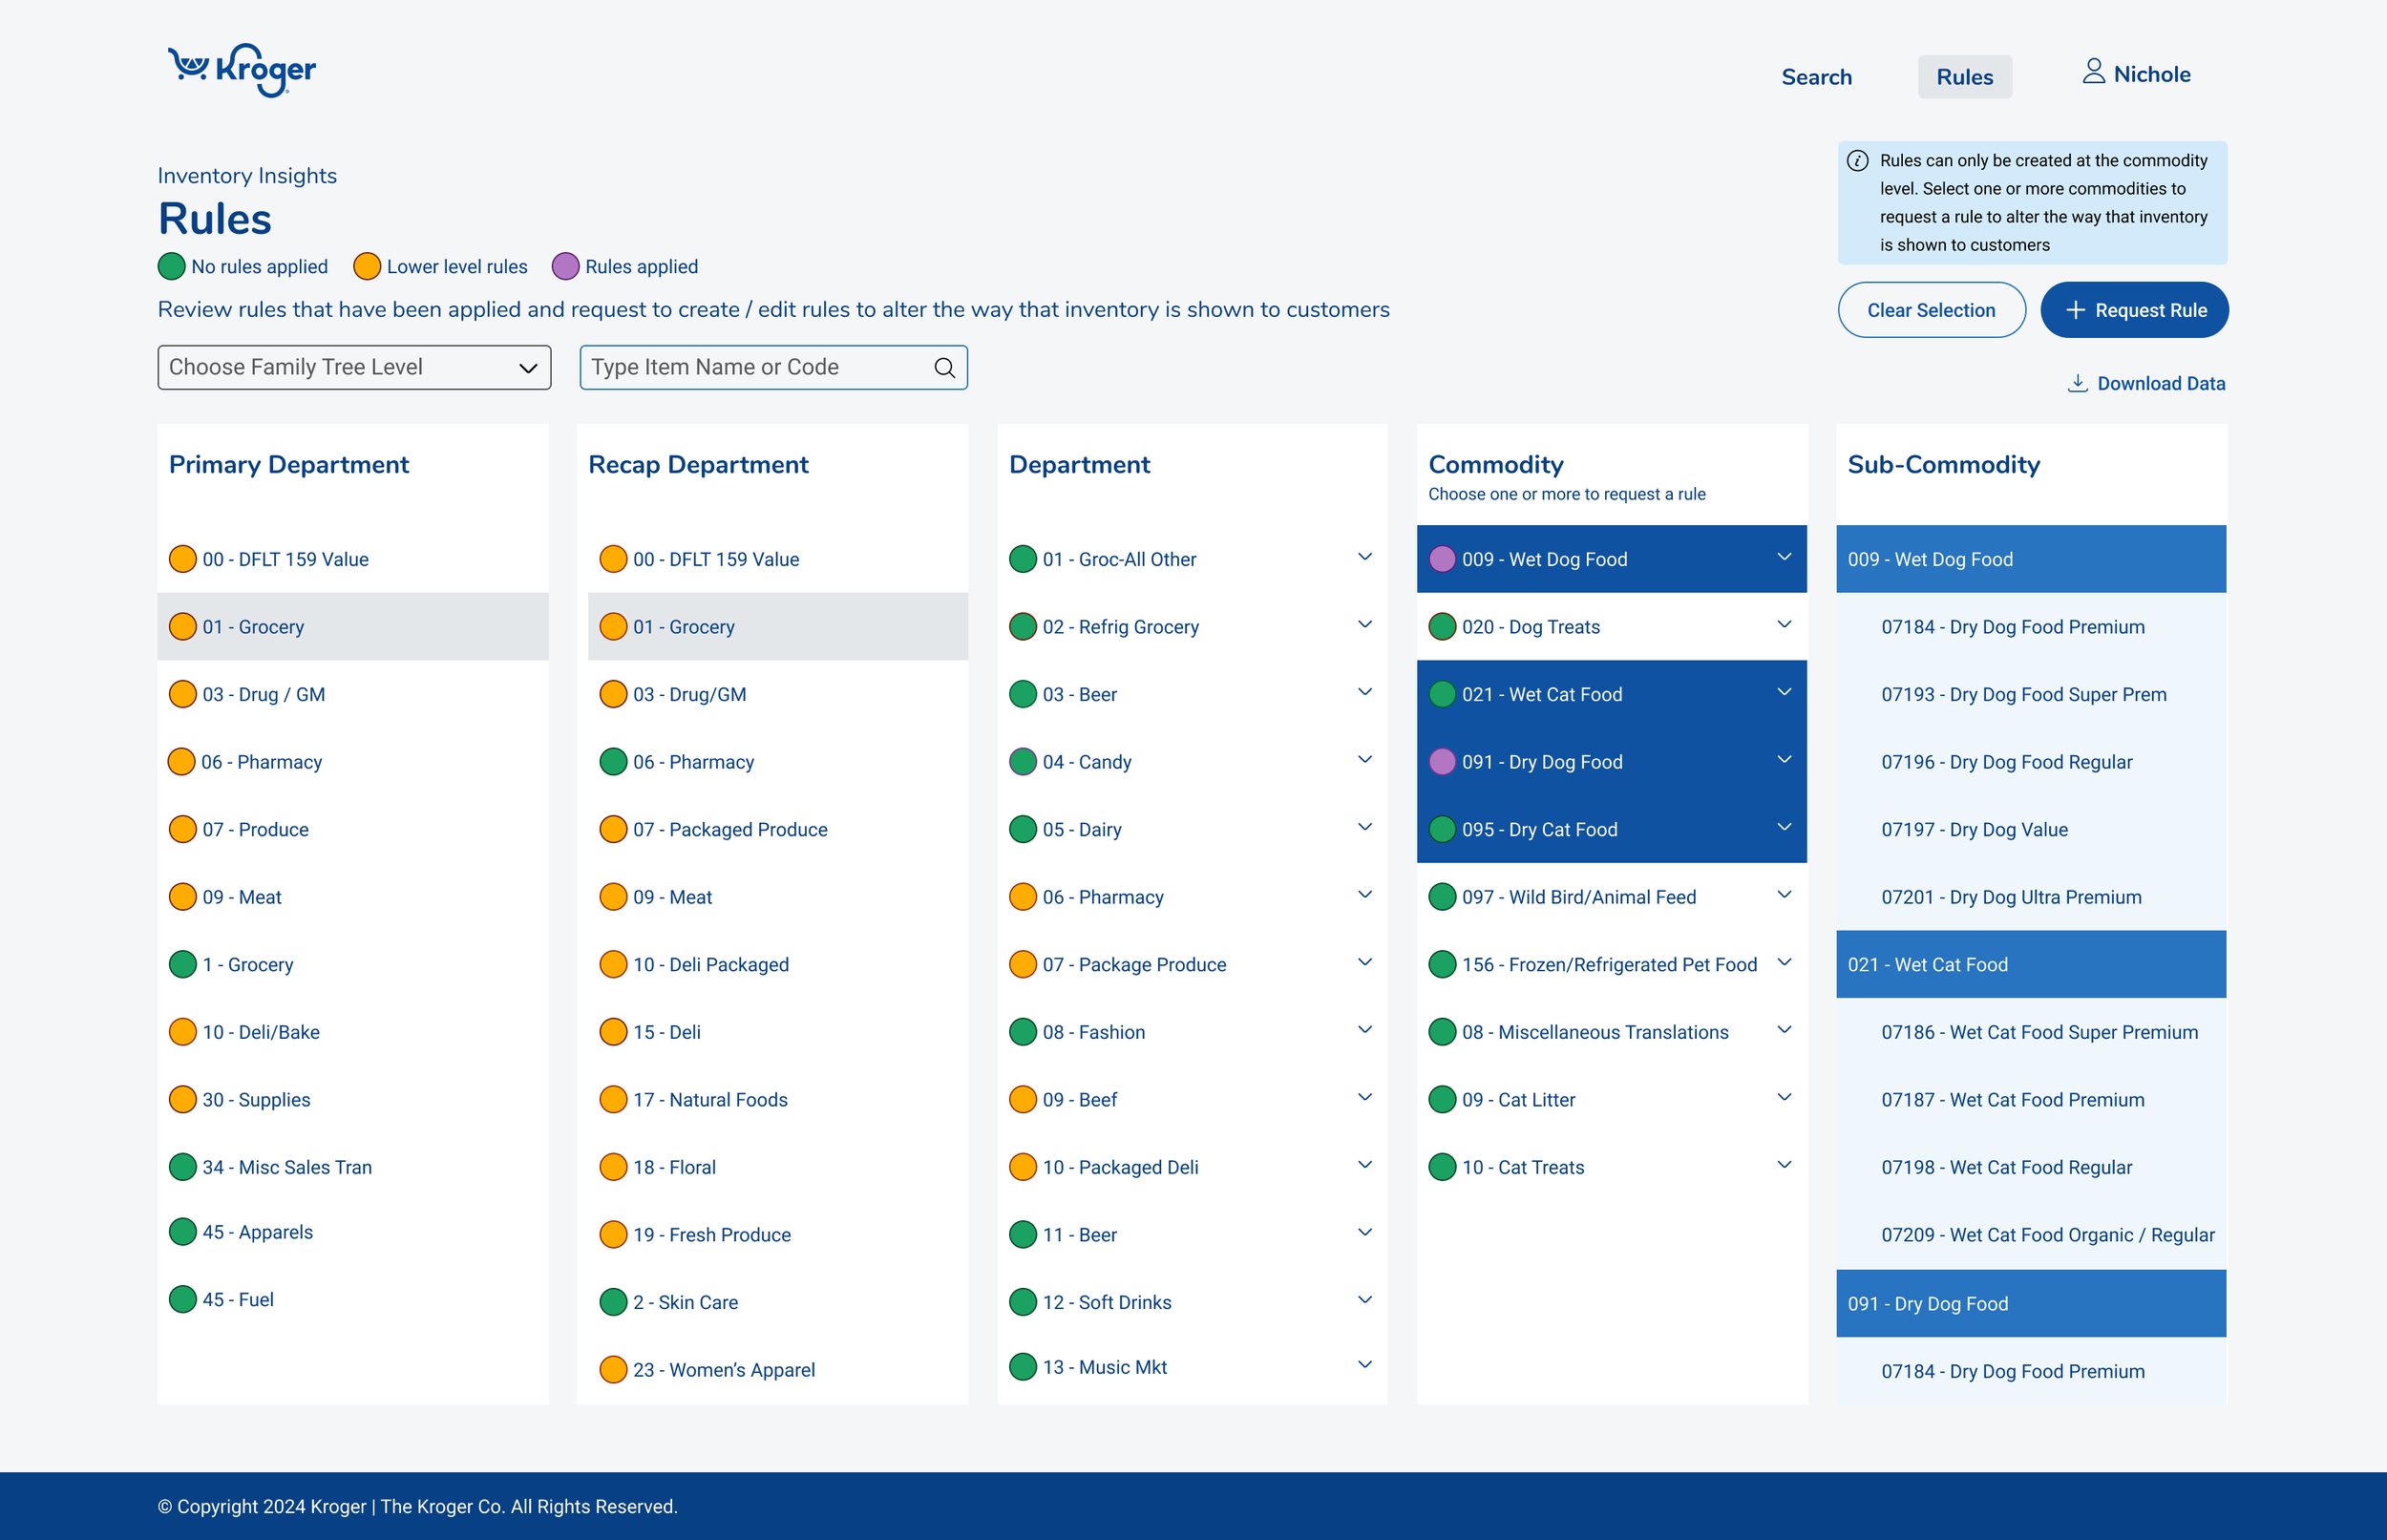
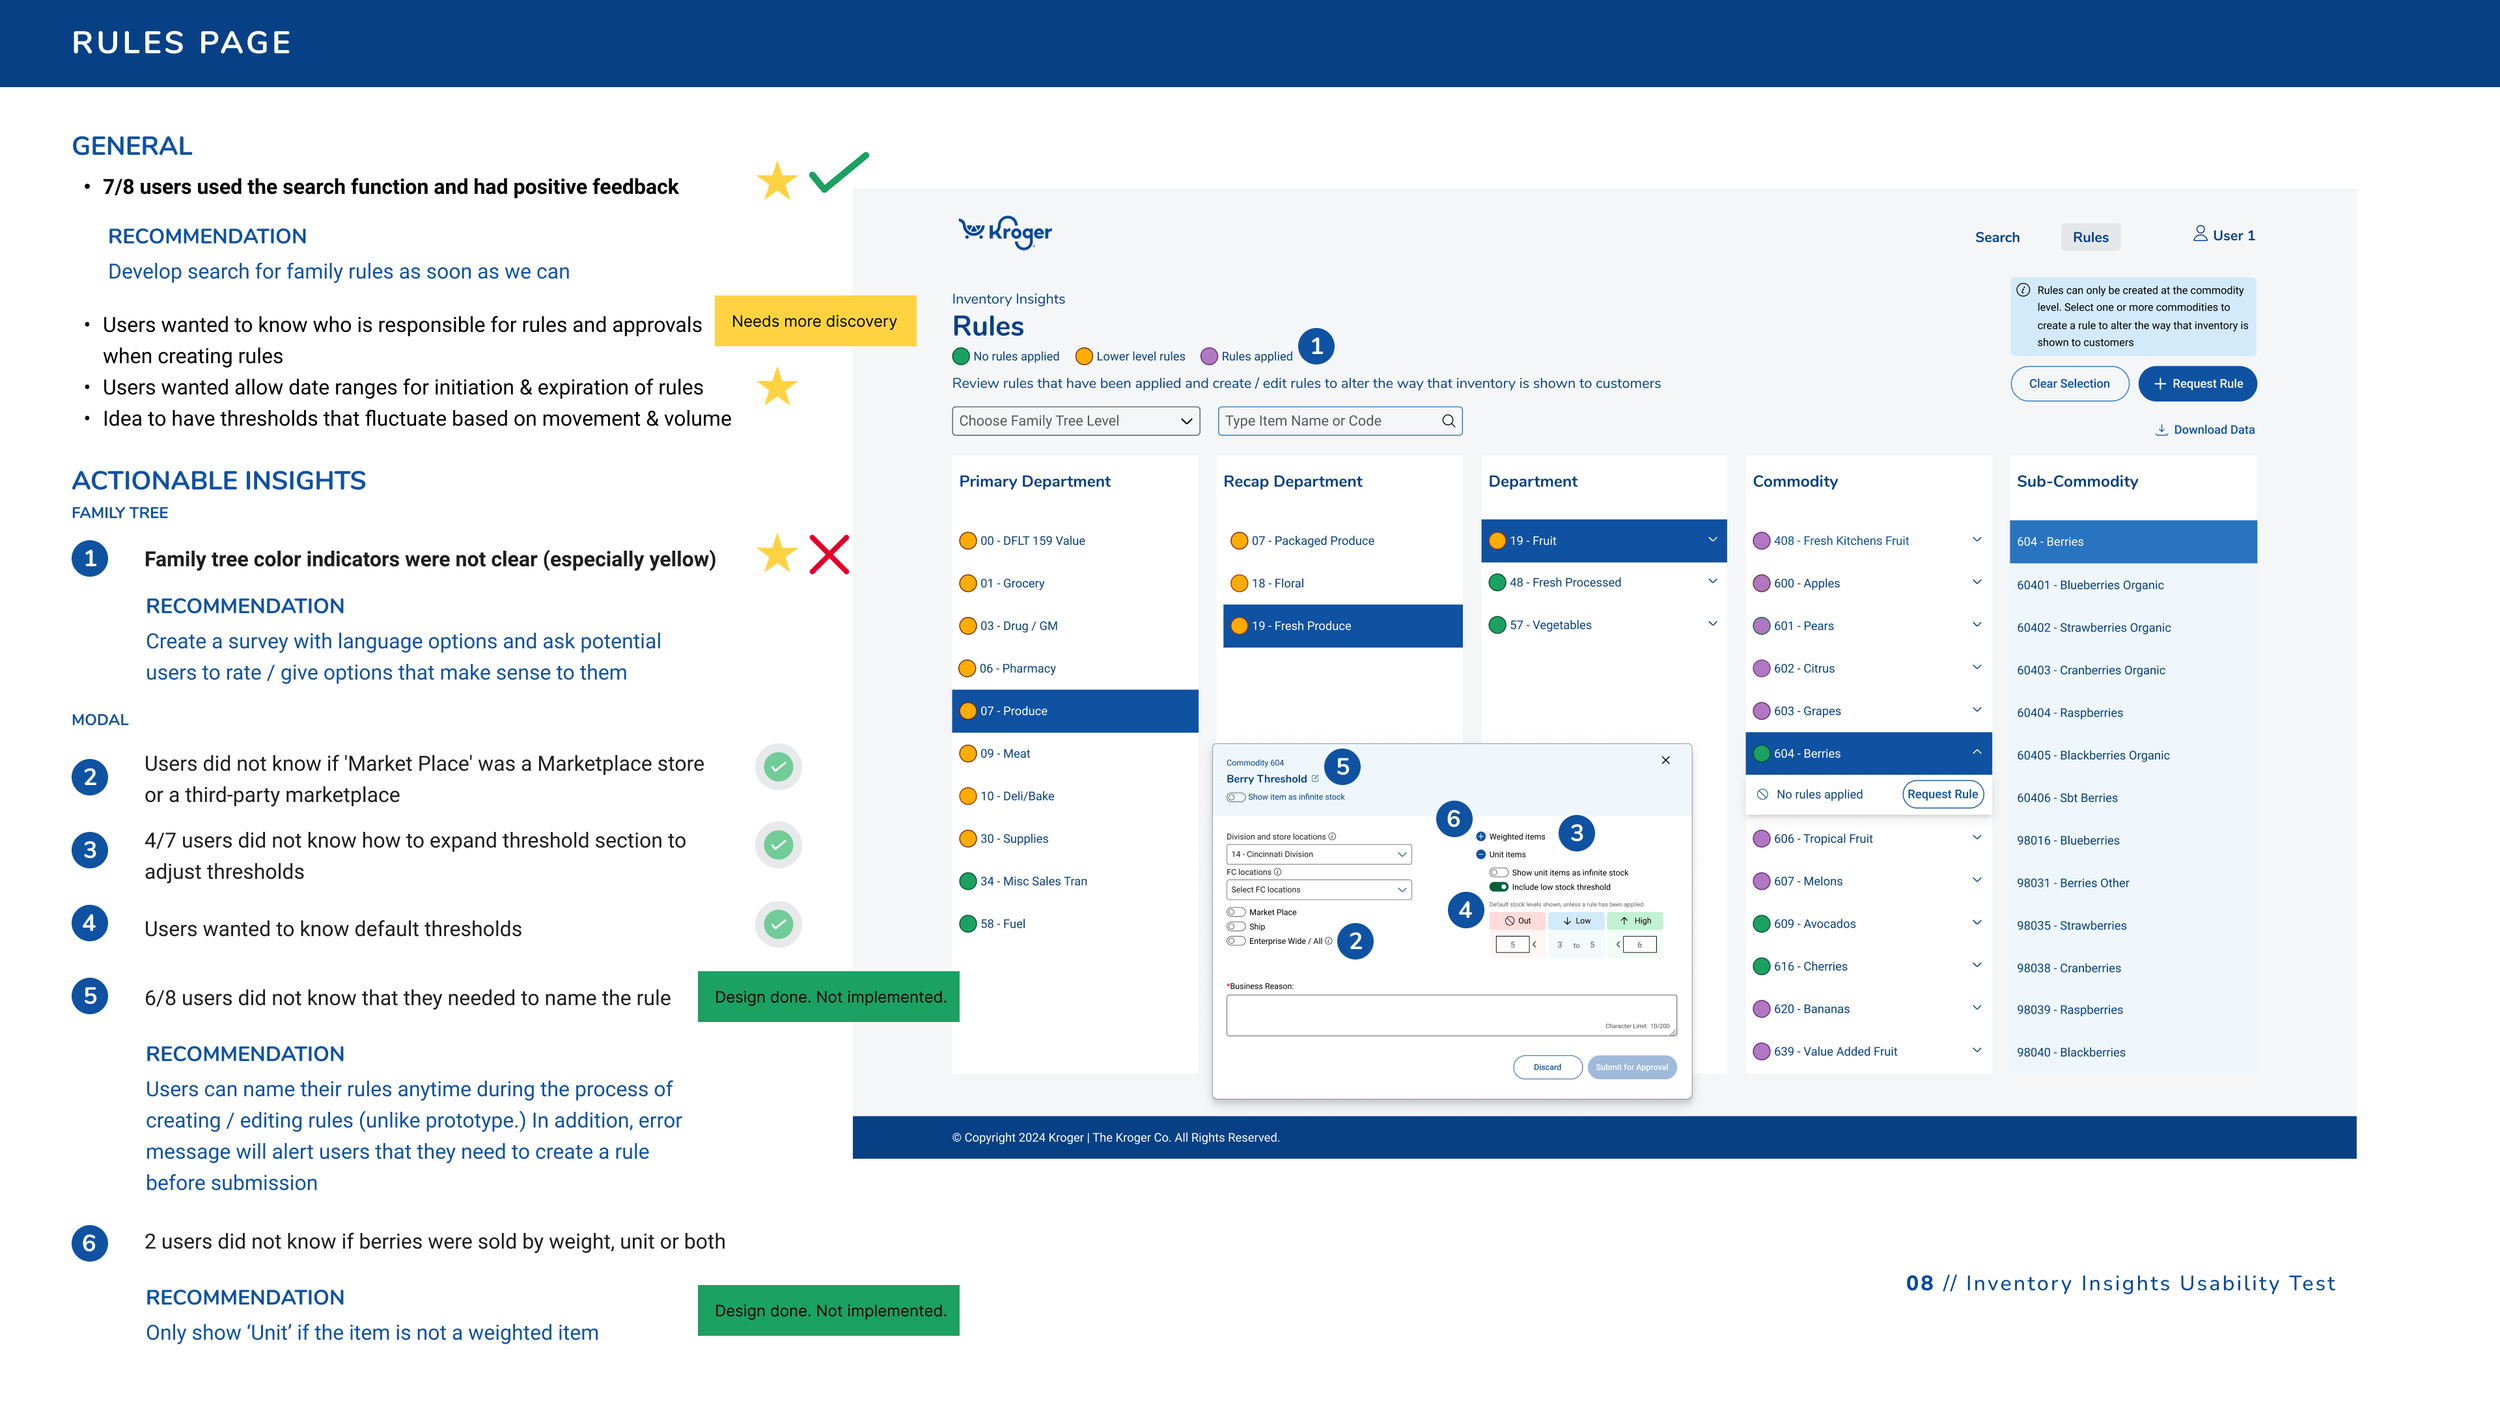
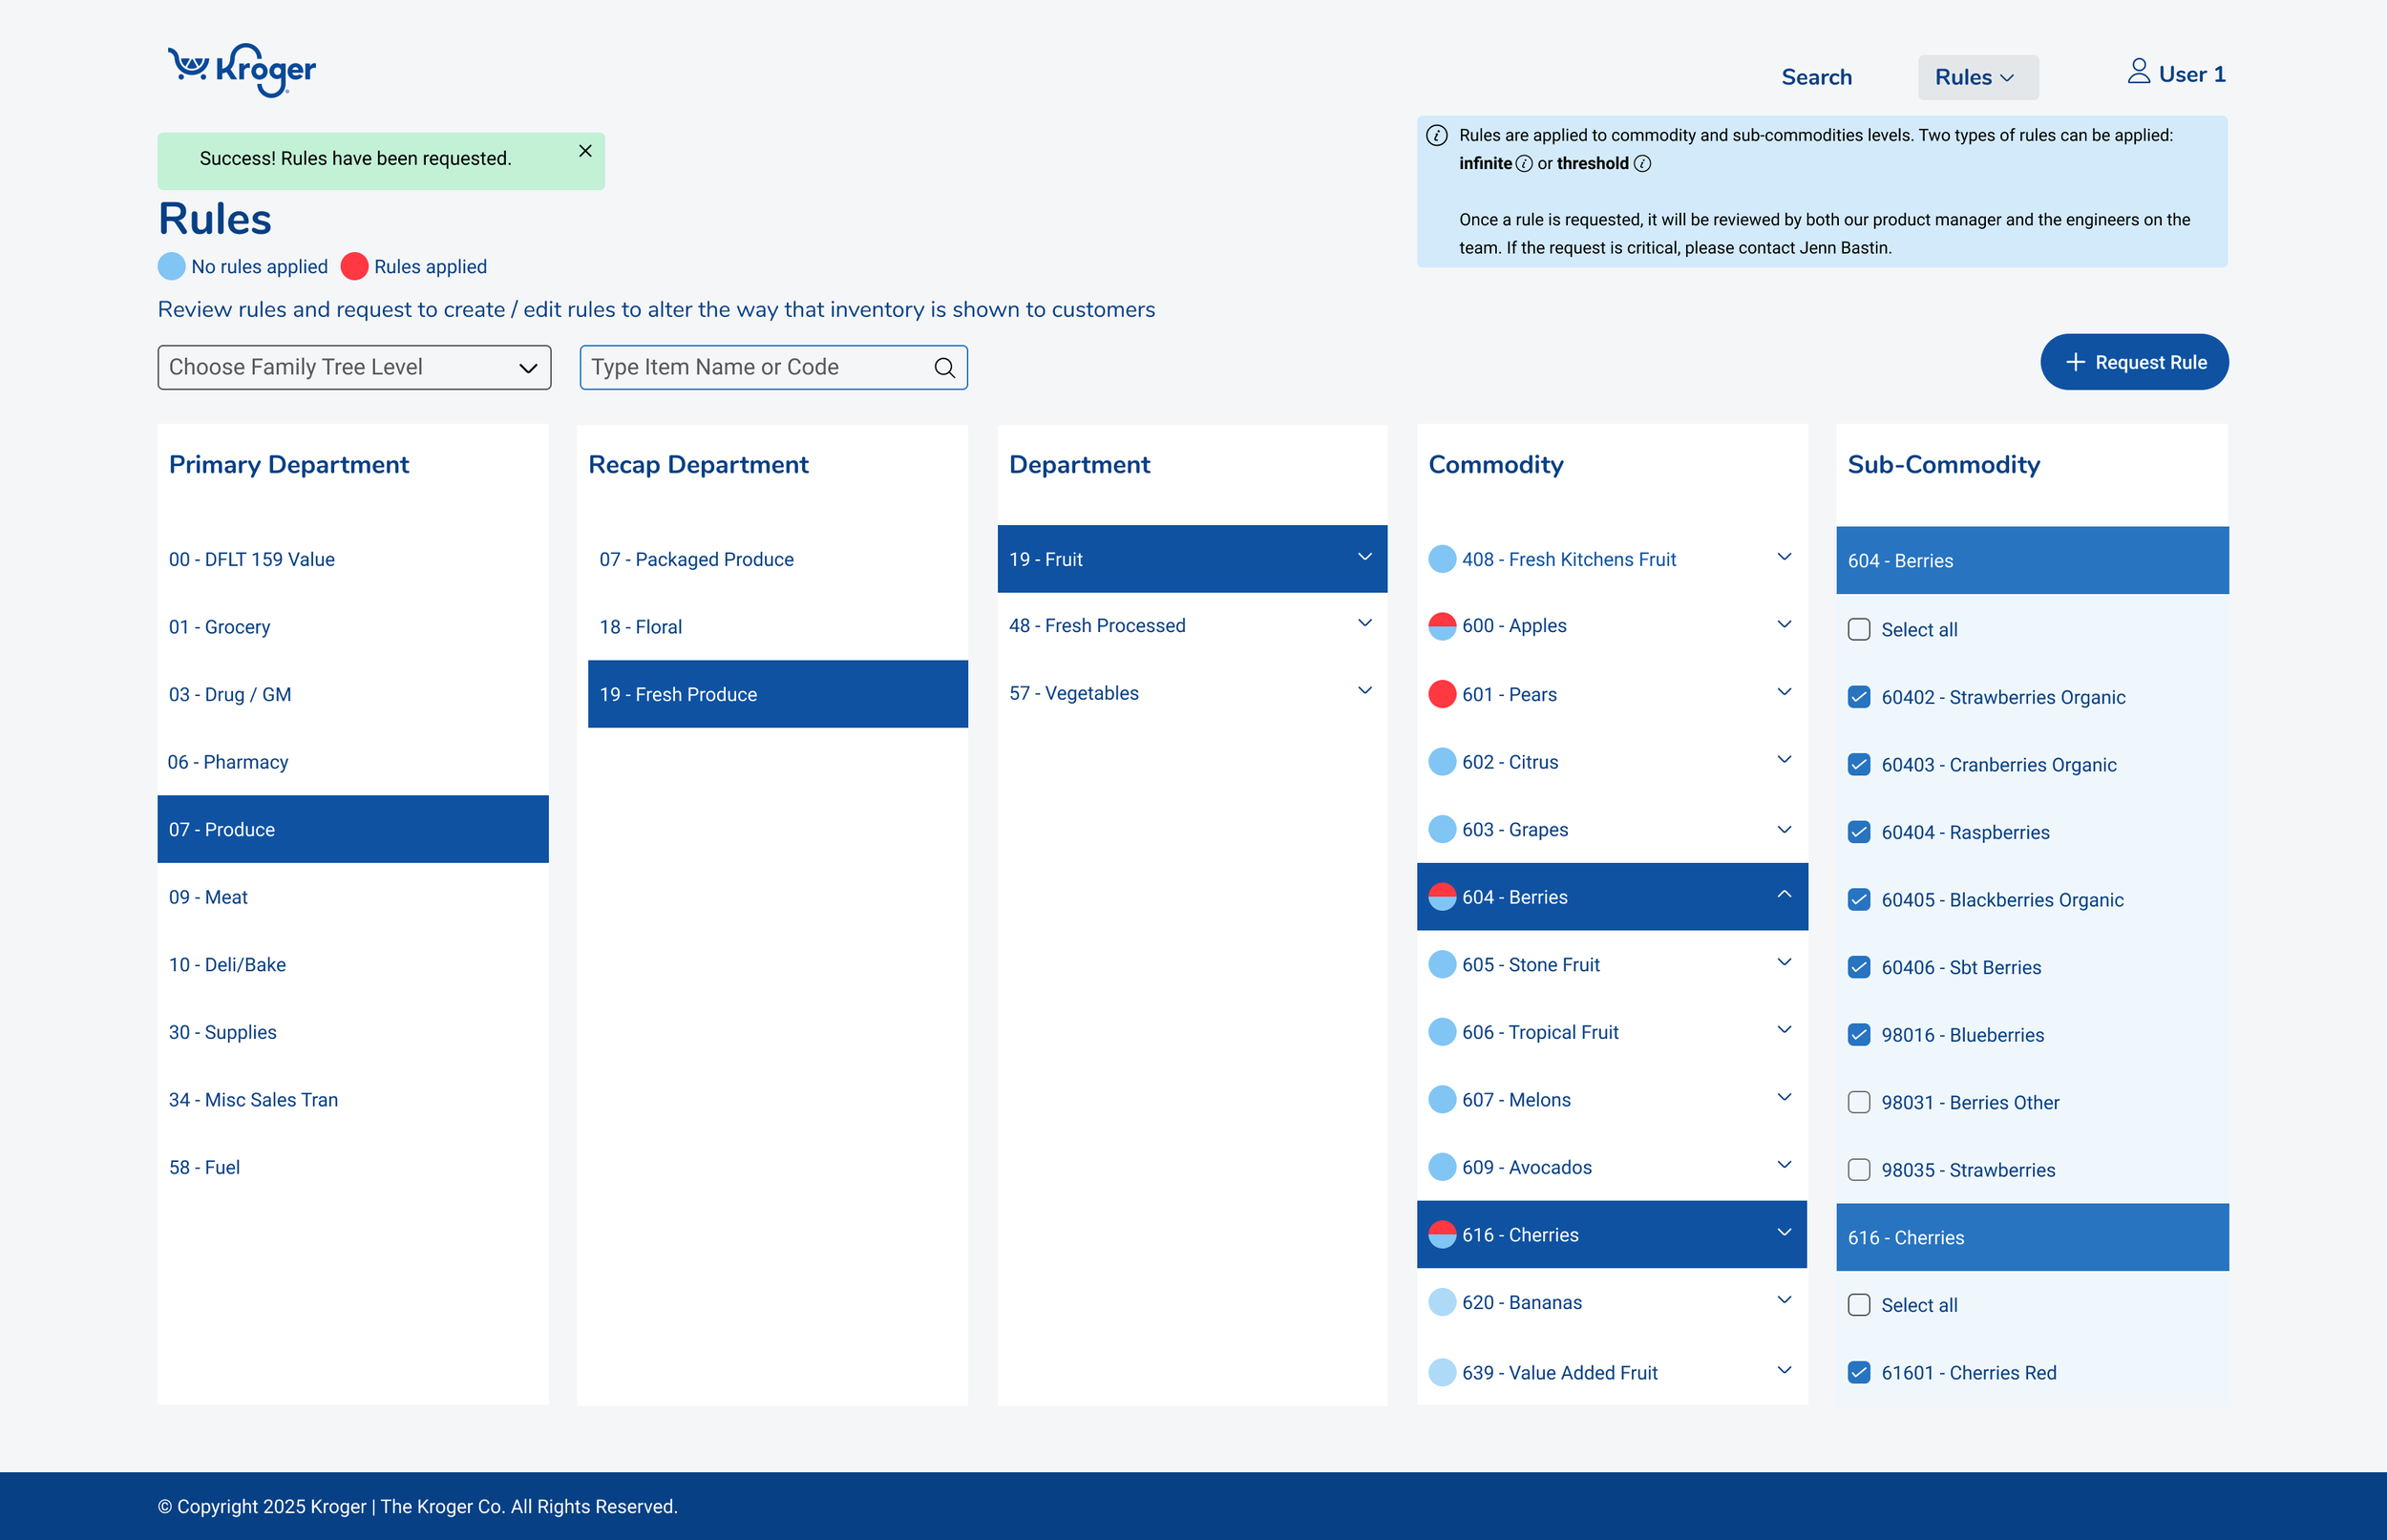
Rules Page
The rules page allows user to view items by their family tree (hierarchy of departments to sub-commodity) and which items have rules (based on color coded indicators).
Feedback
Feedback from other designers (rose, bud and thorn exercise)
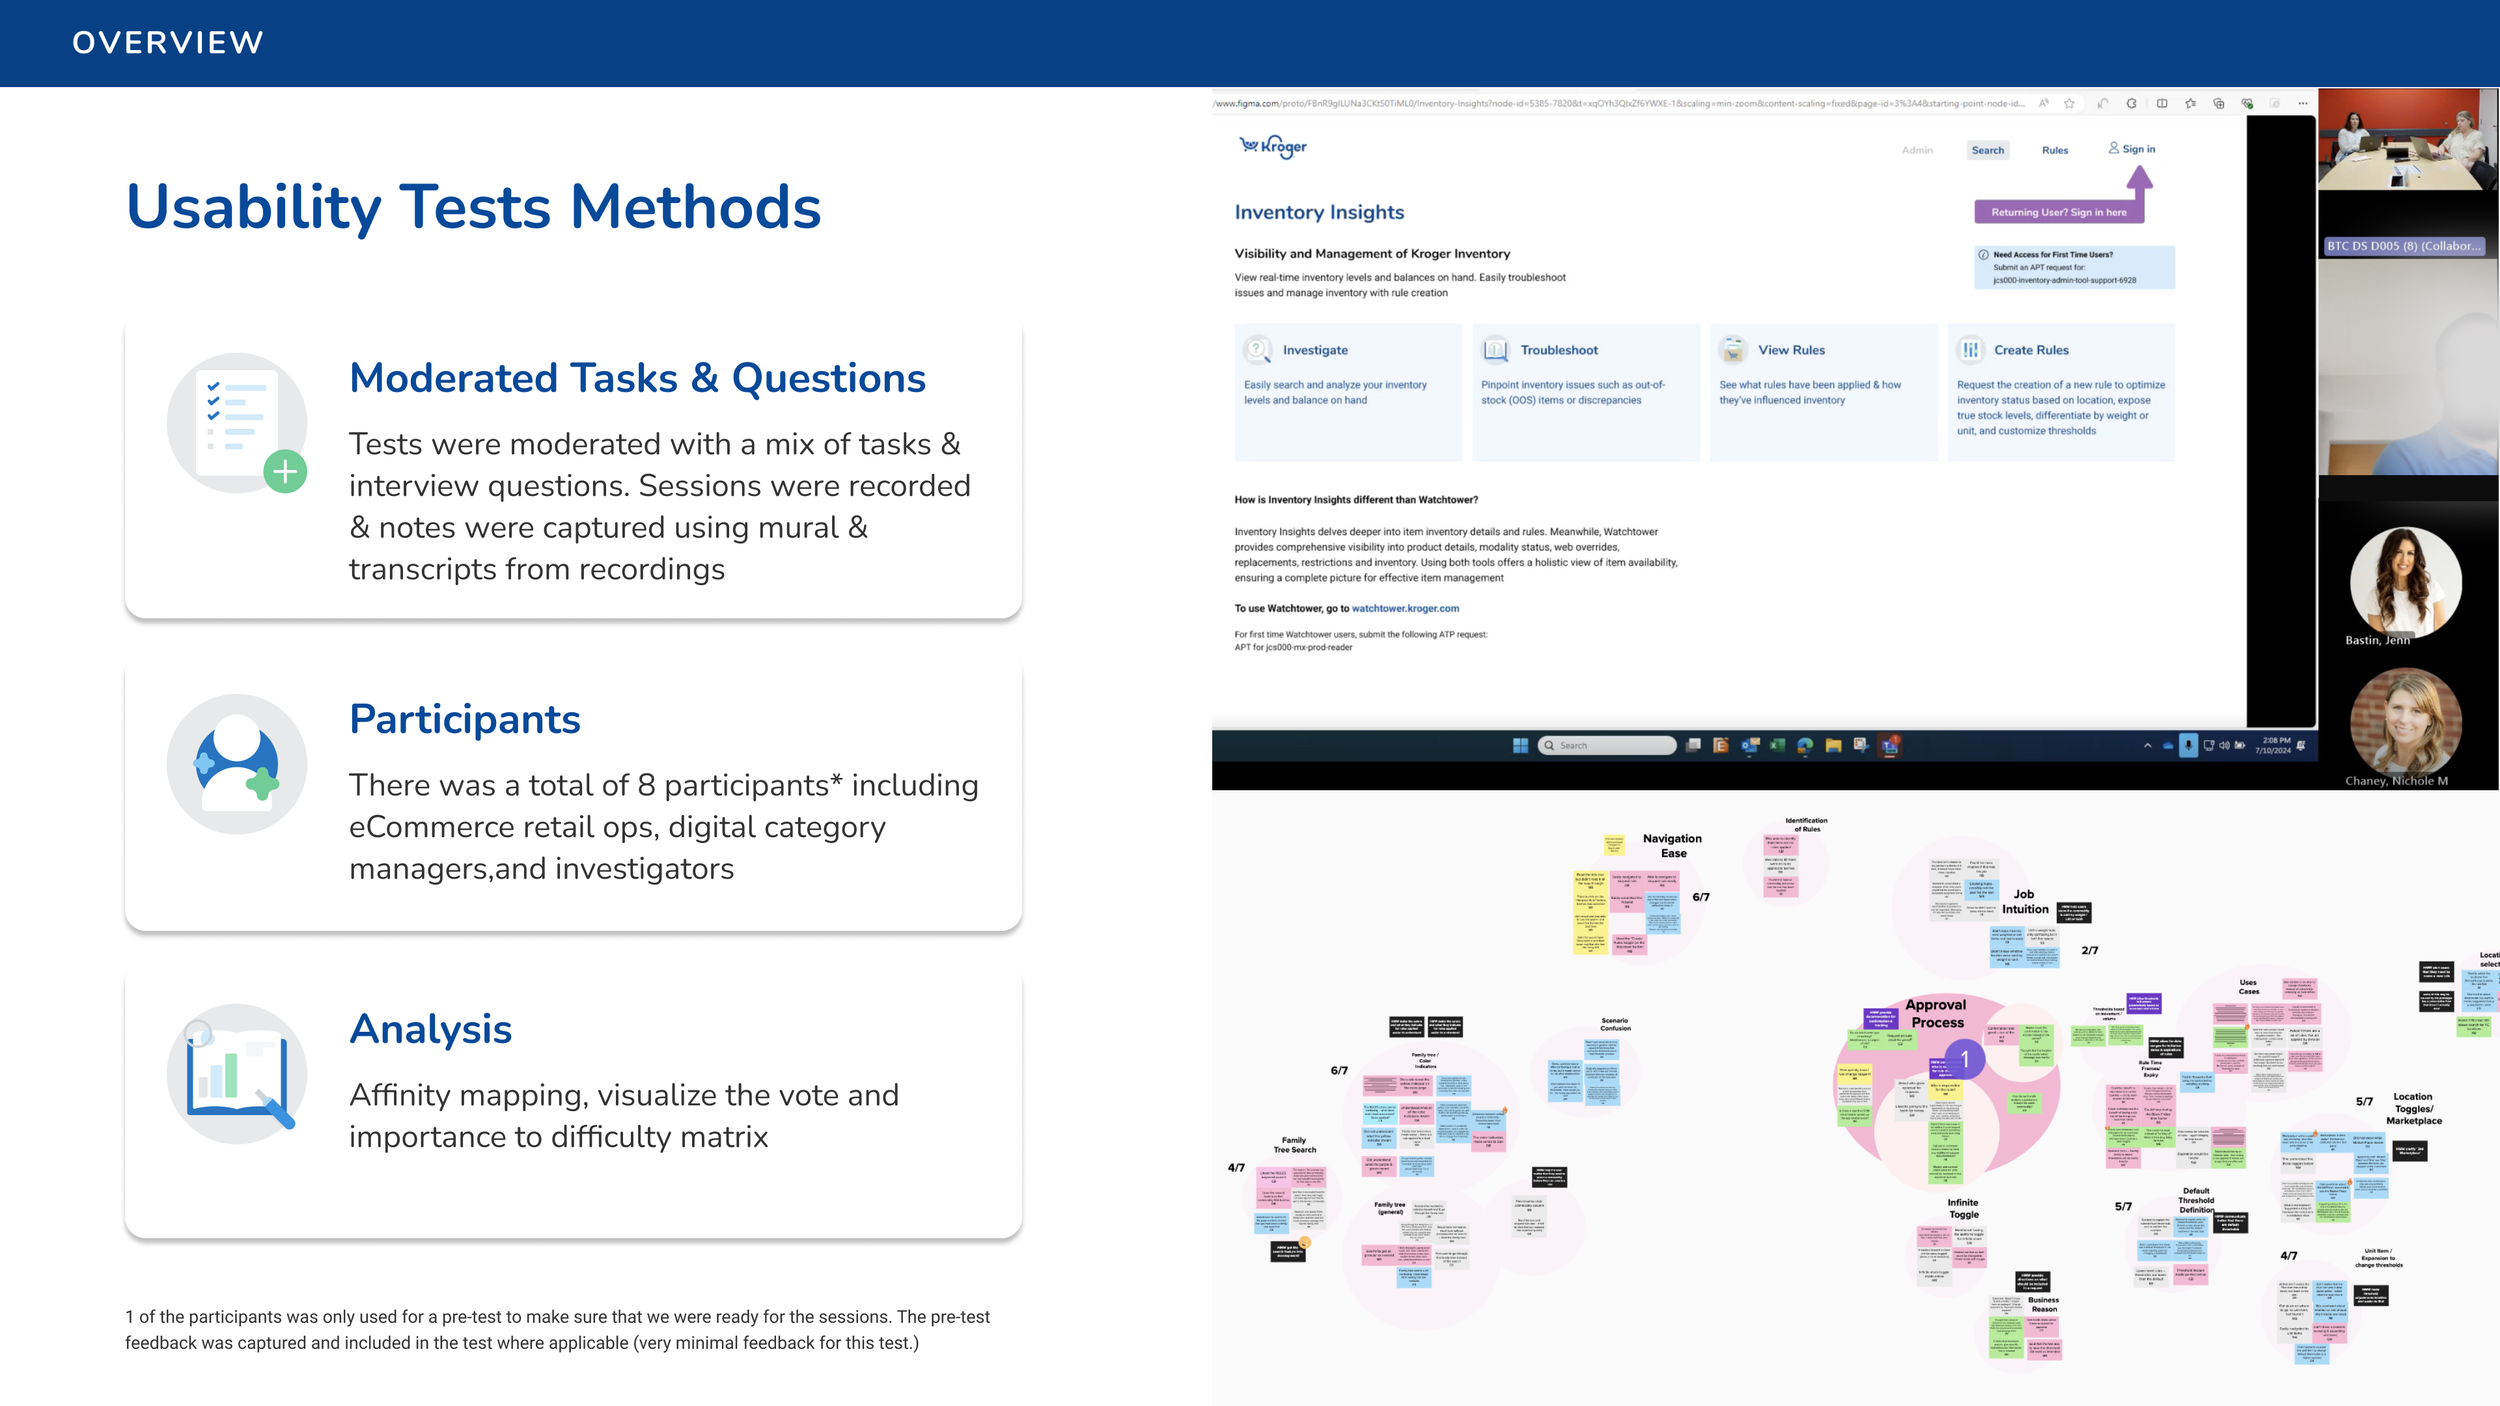
Usability test / interviews from users and potential users
Rose, bud and thorn critique with designers
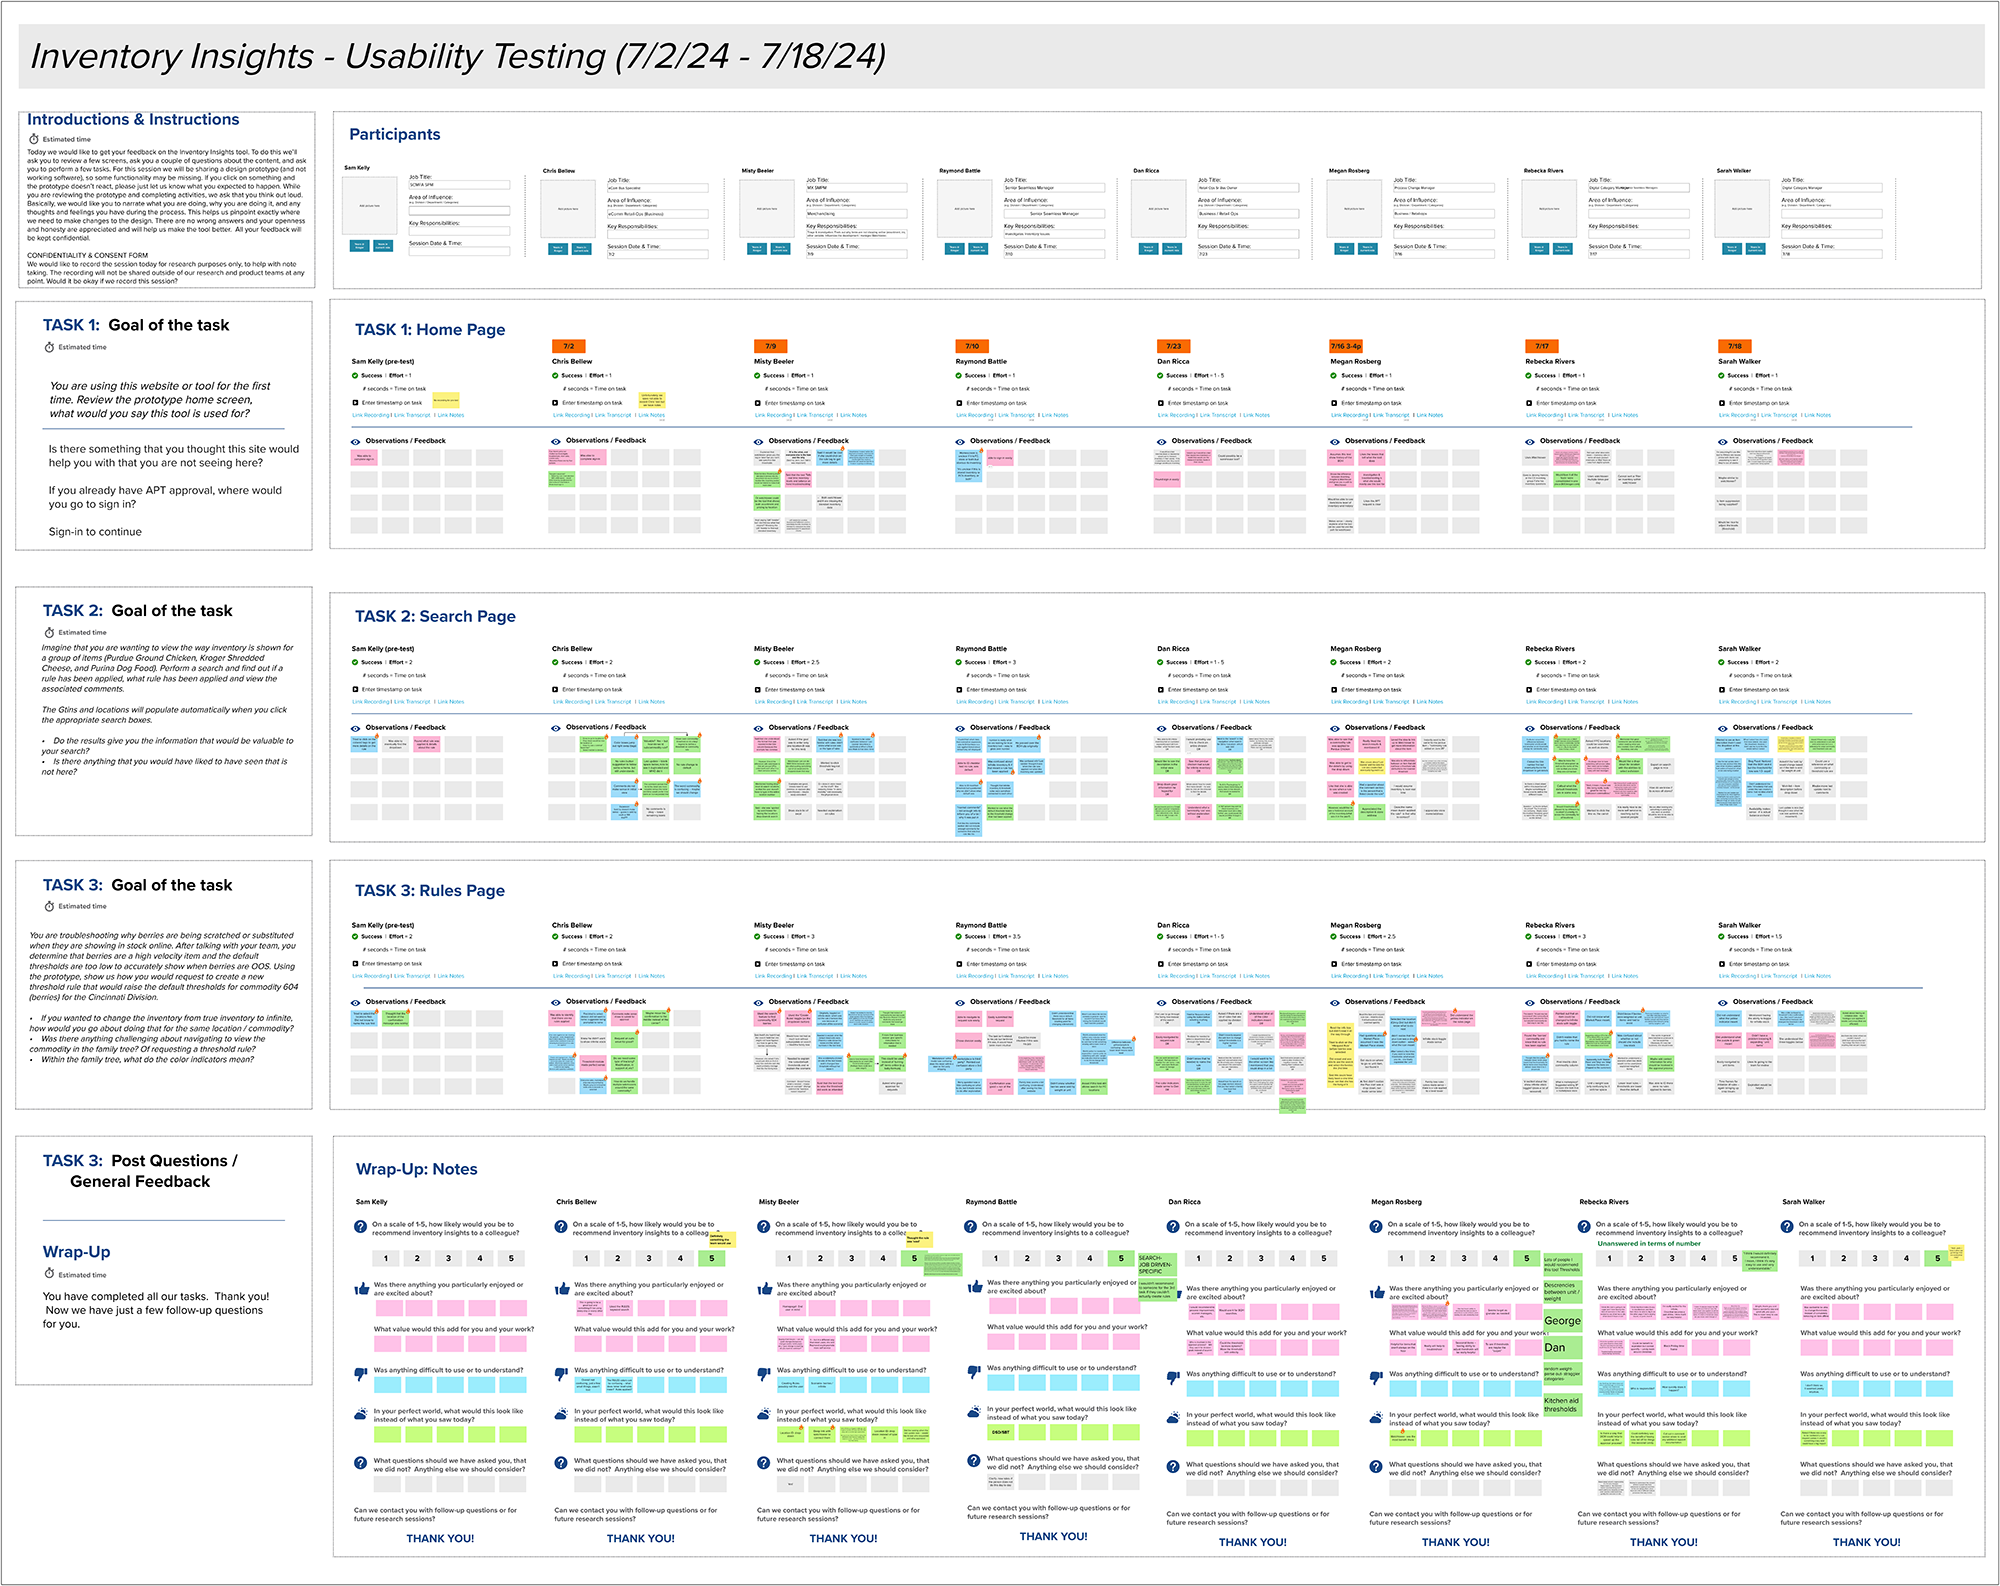
Usability test and interview documentation
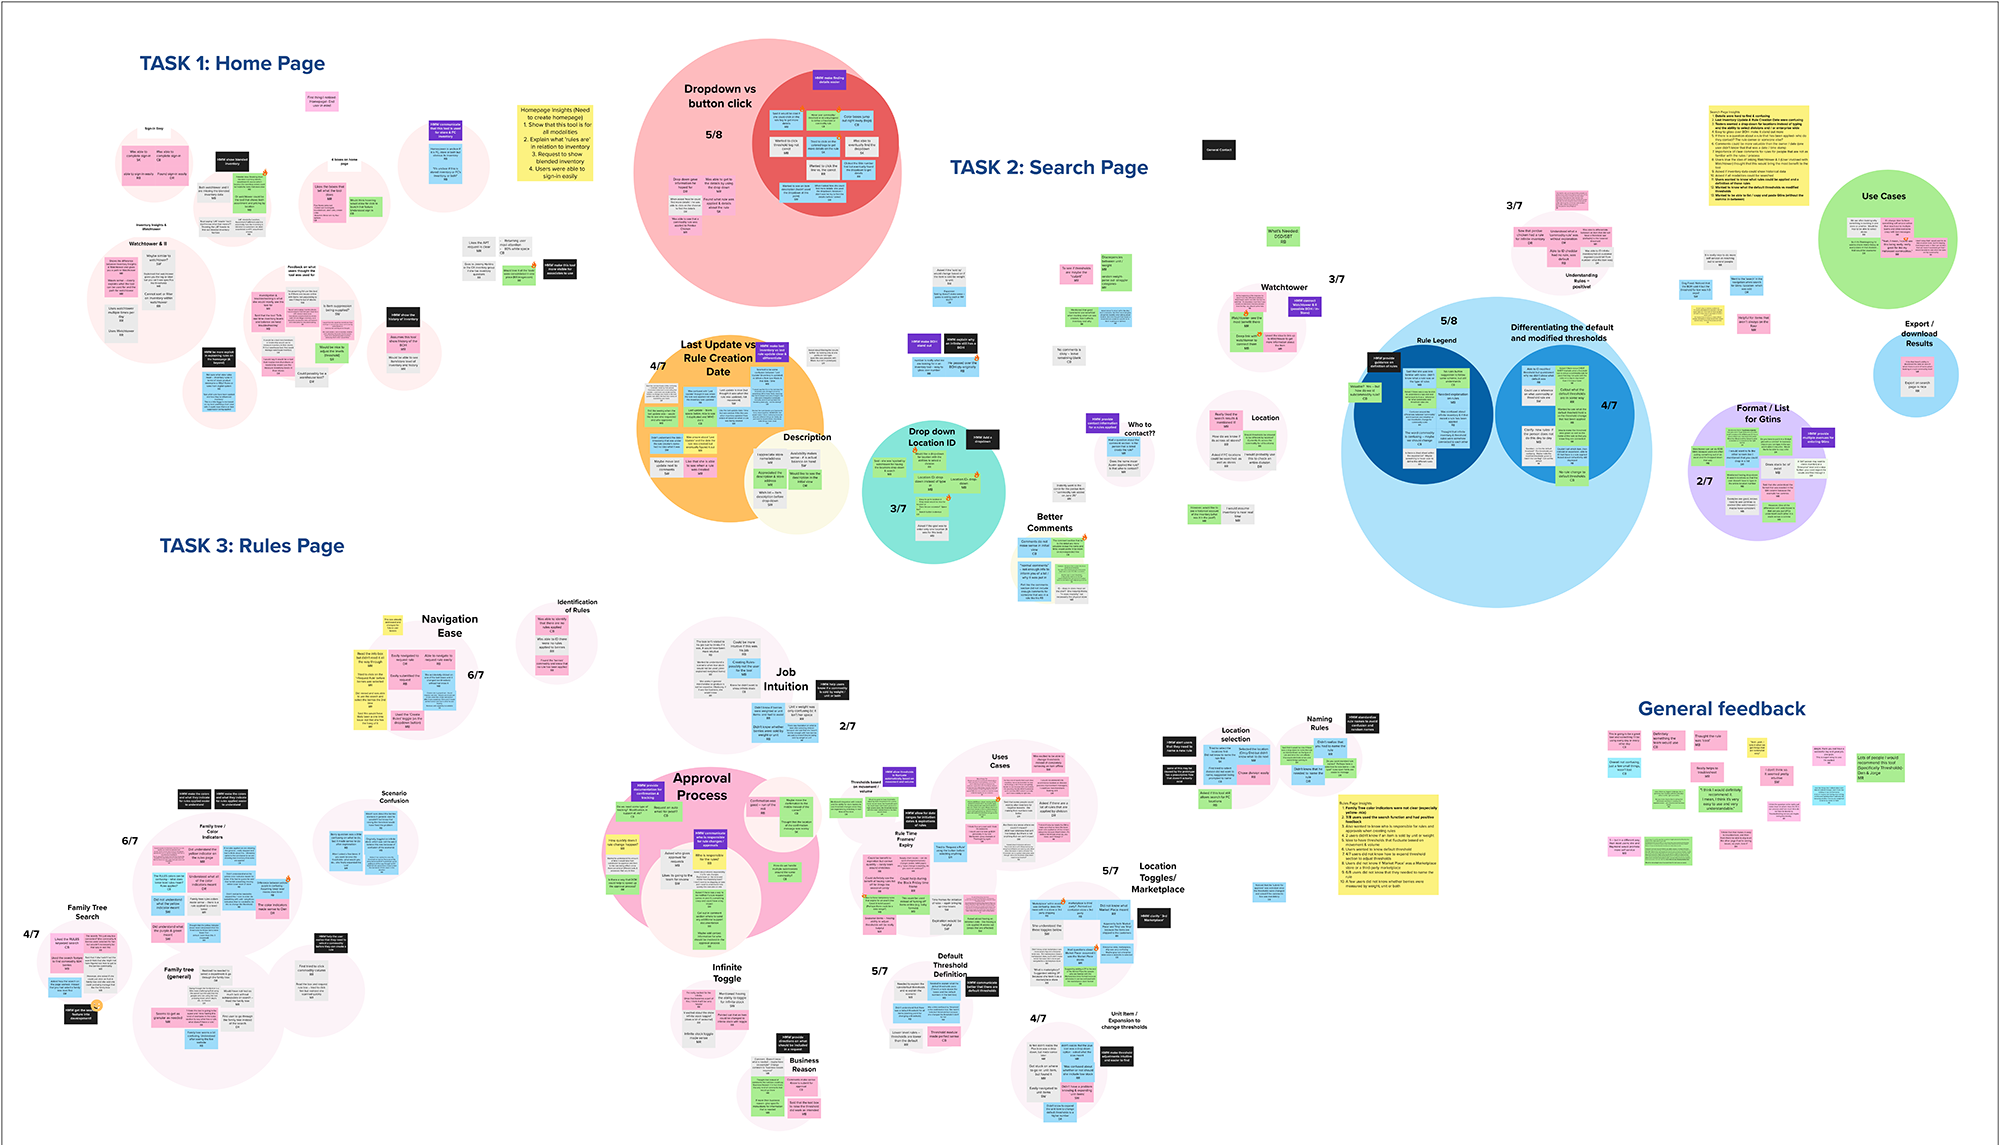
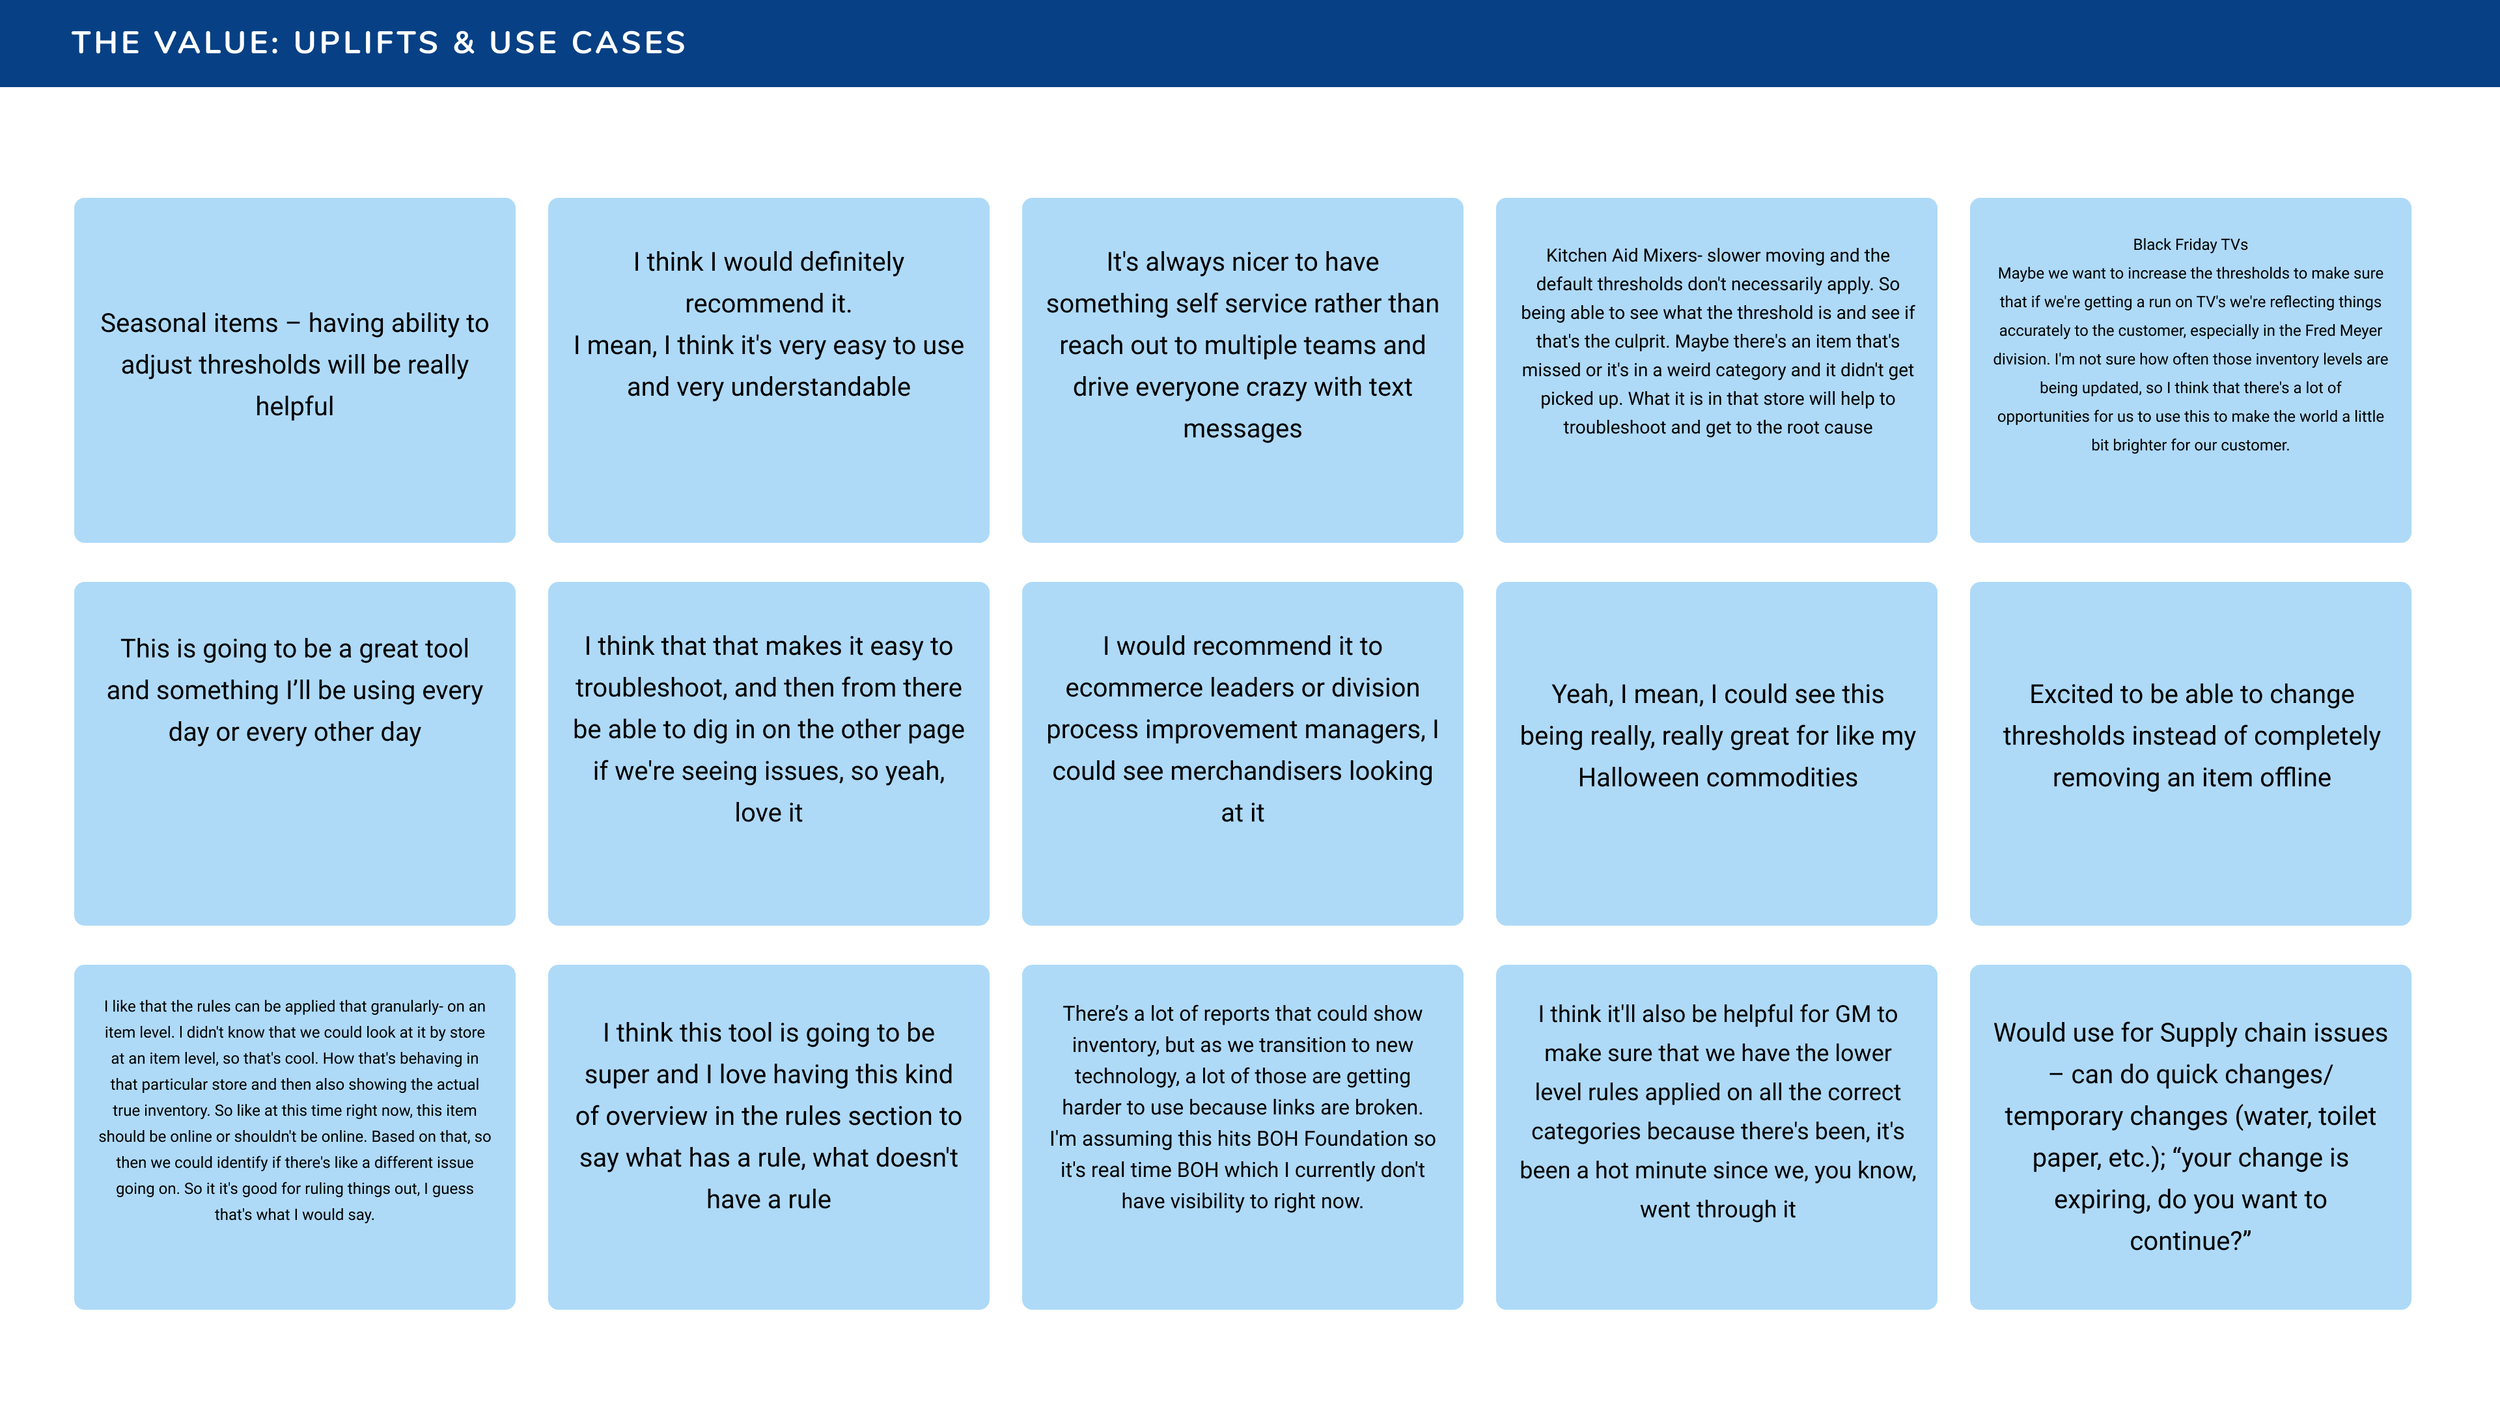
Affinity mapping analysis
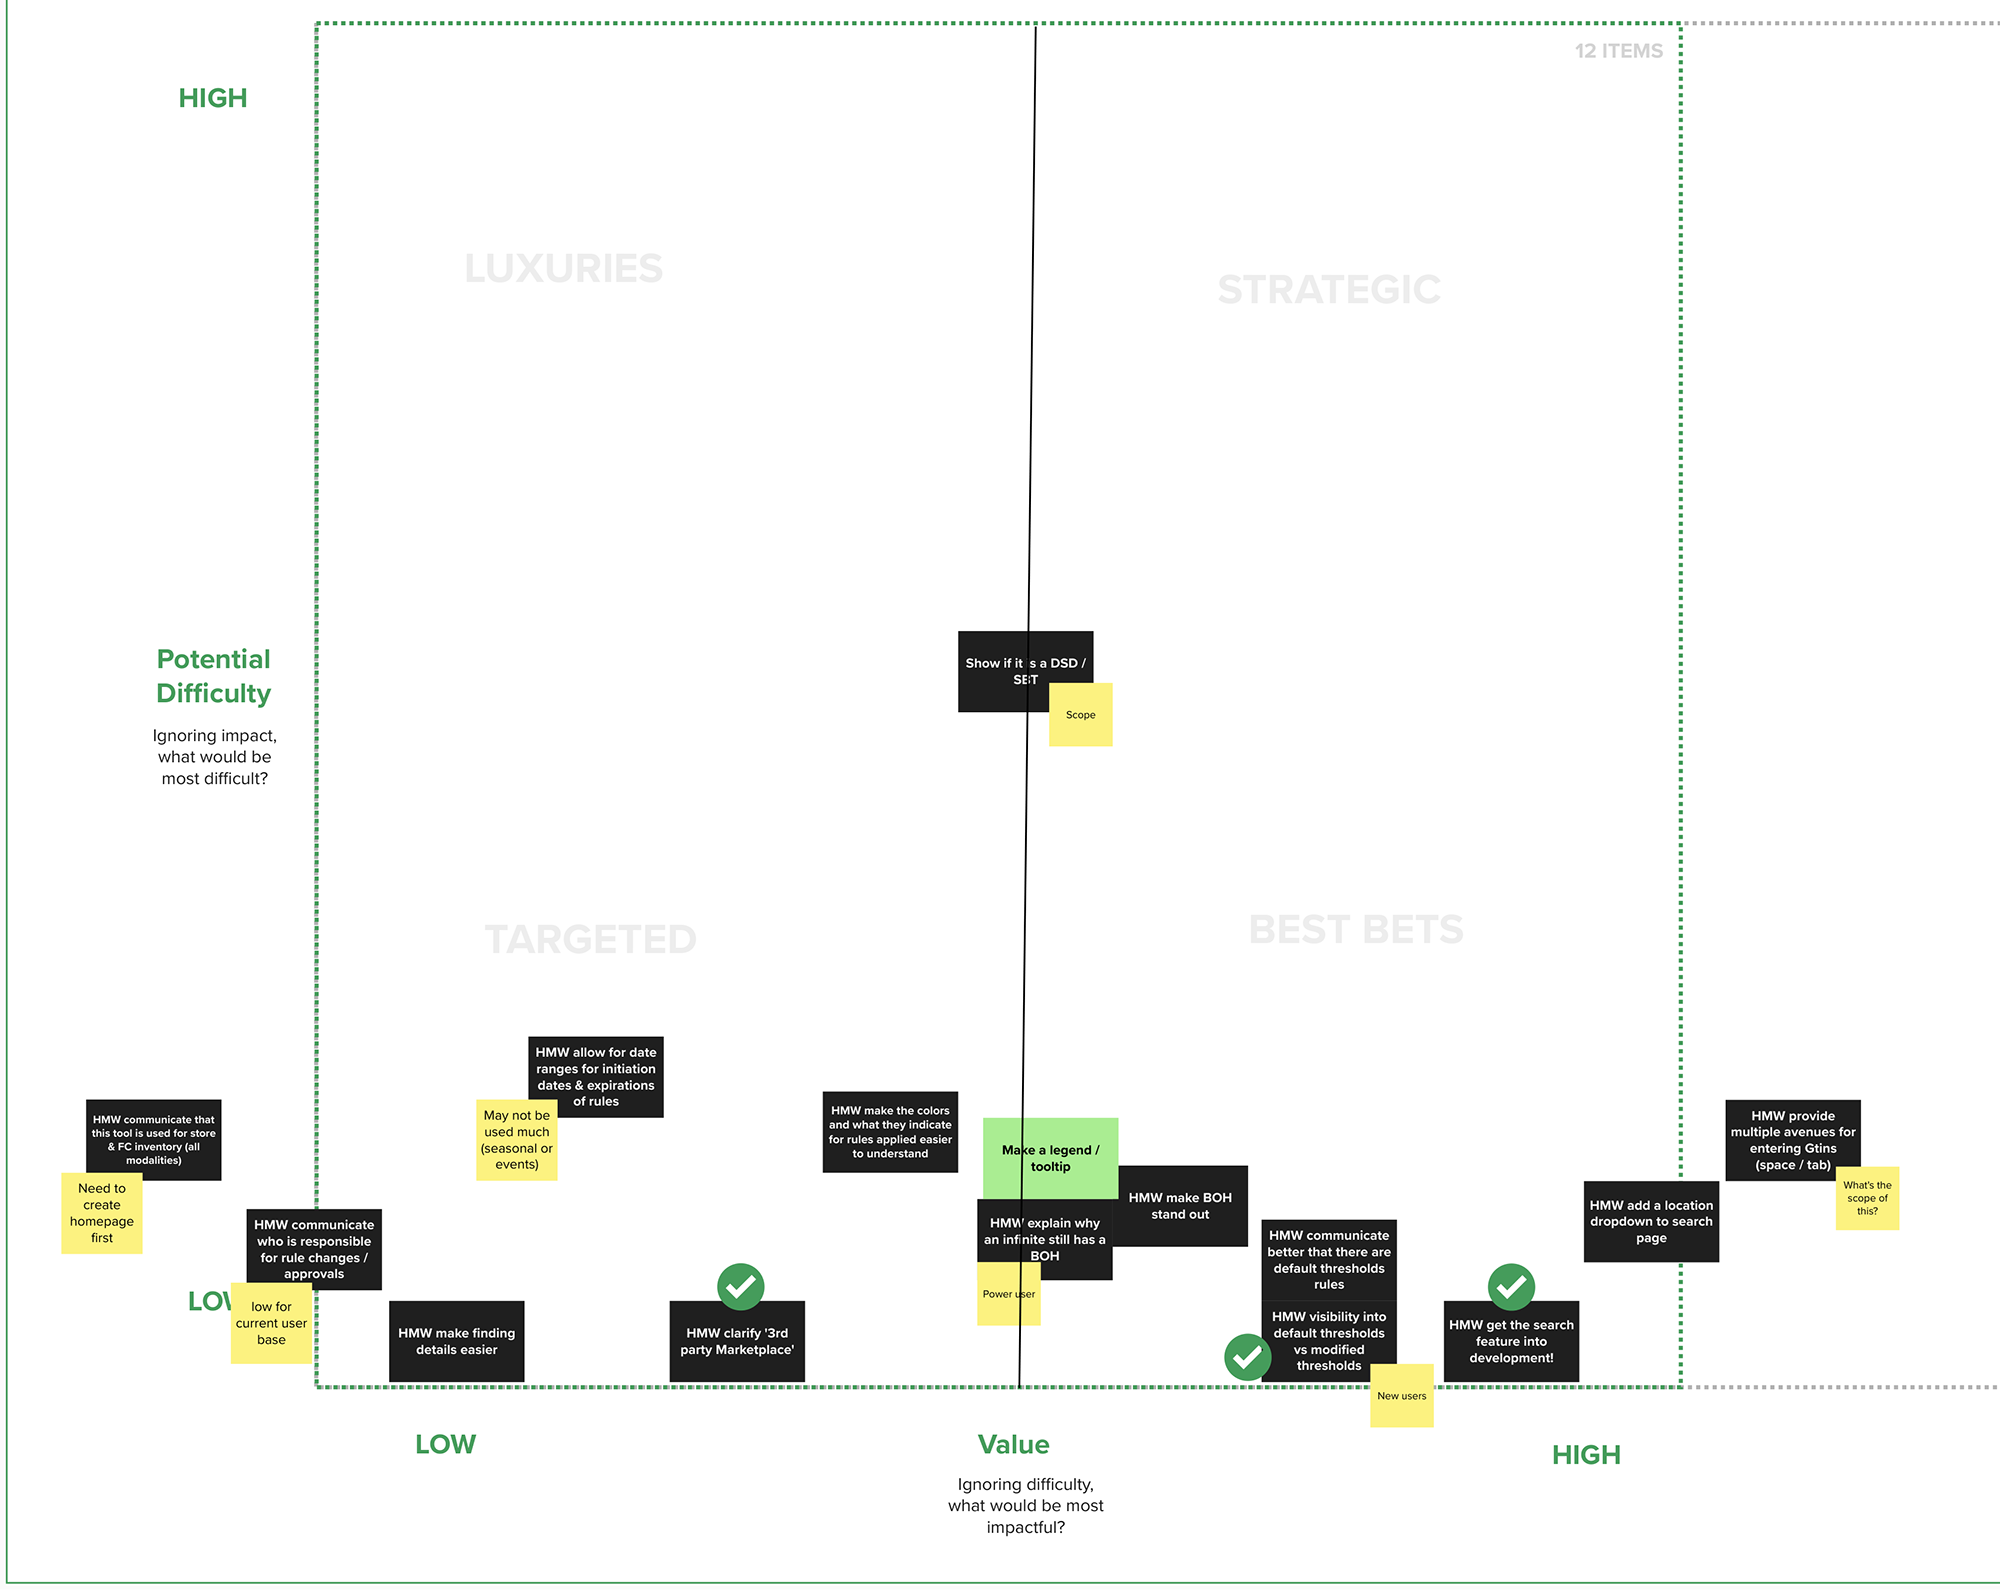
Difficulty and value matrix
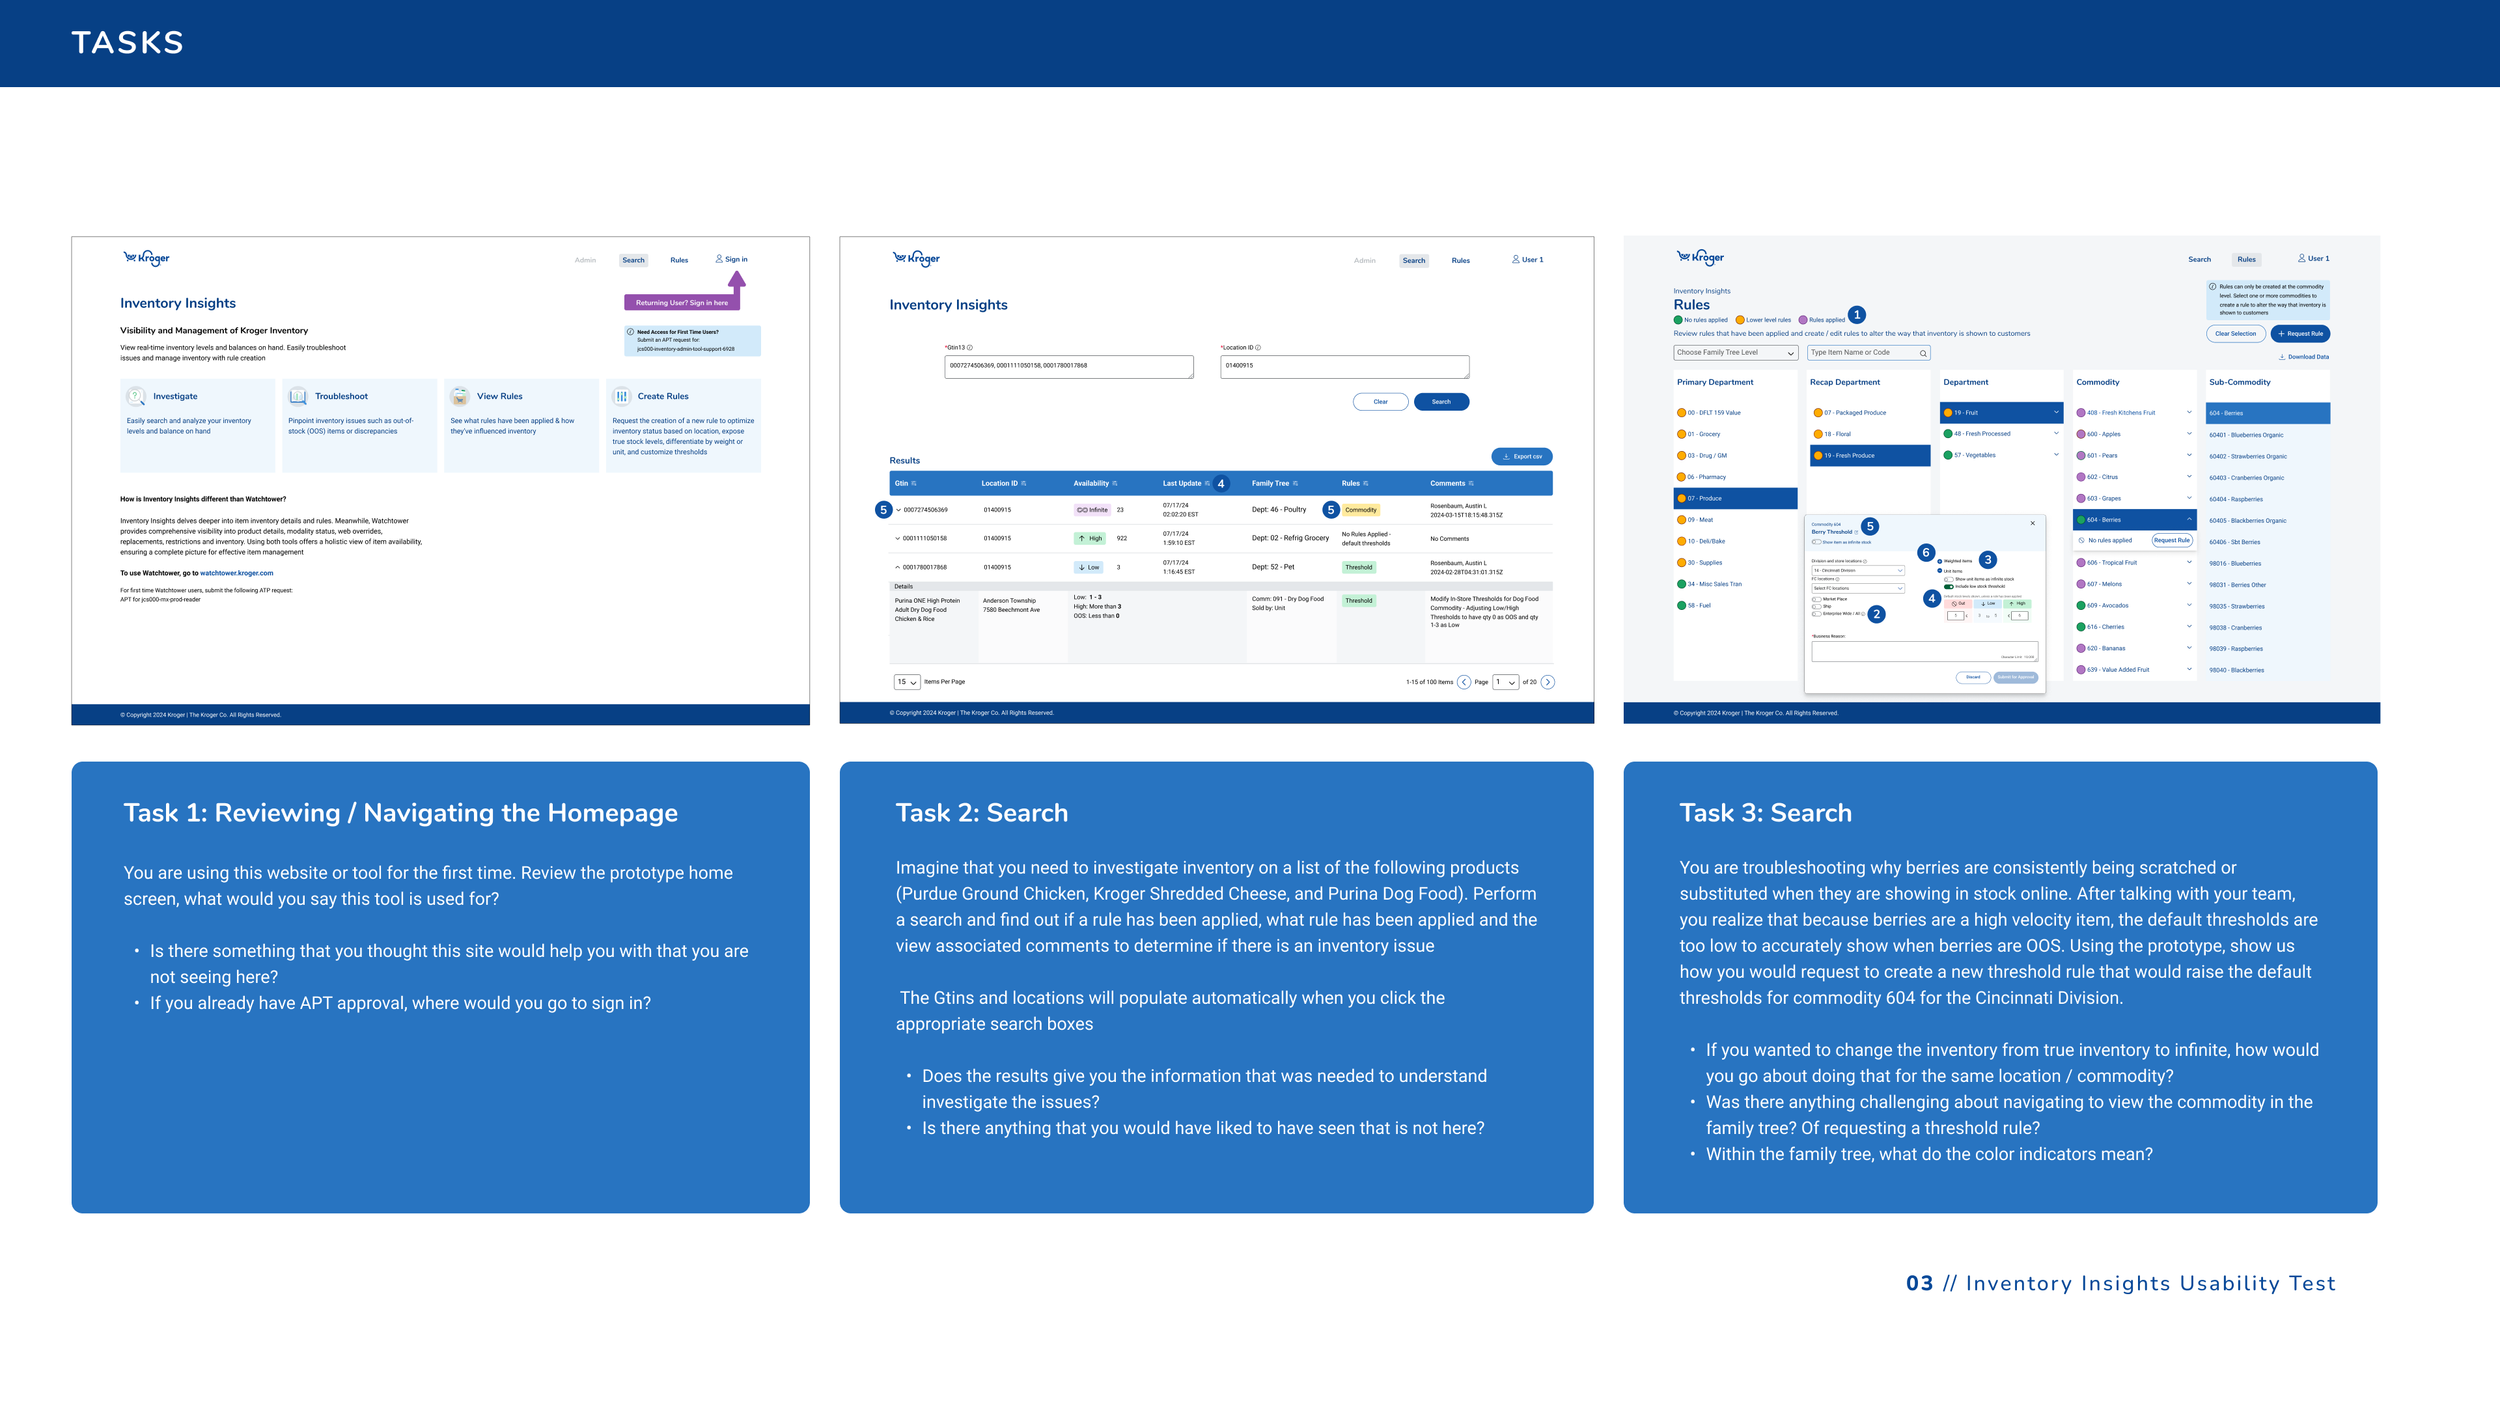
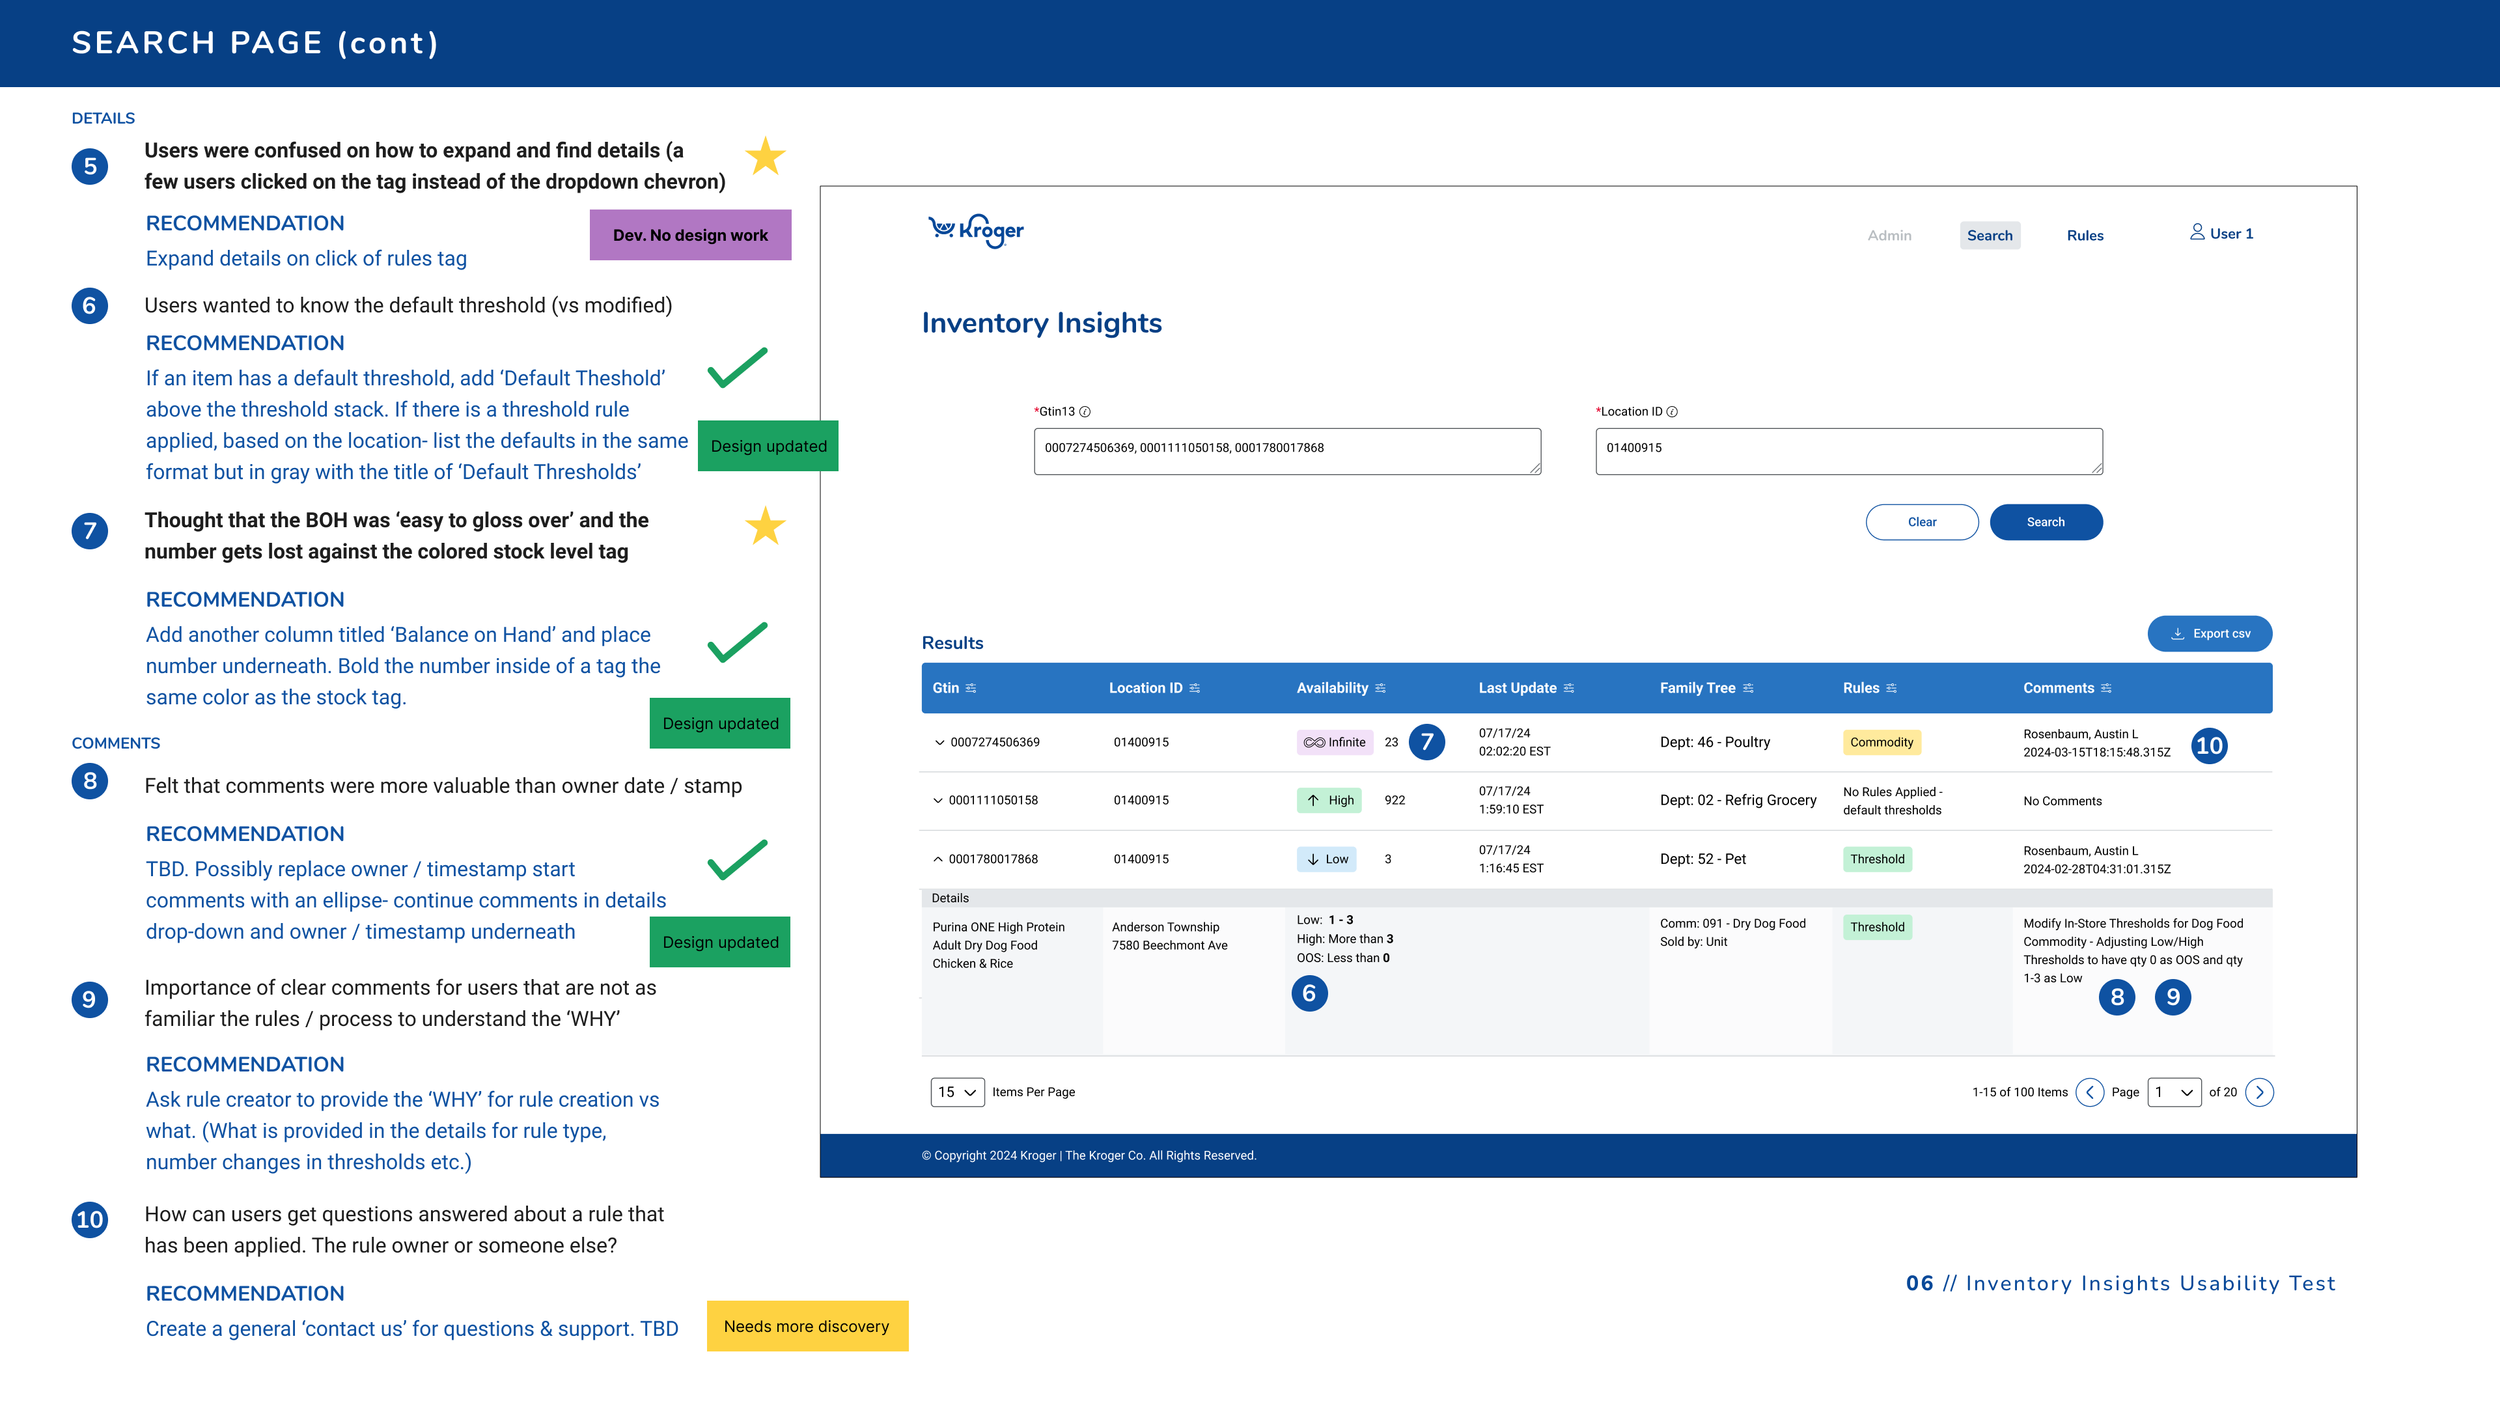
Usability Test Results
Overall, users loved the tool and wanted to start using it right away. We also received helpful feedback for what was working, what could be improved and ideas for new concepts and features.
The feedback was prioritized using the importance / value matrix: some quick wins were implemented in the next development release and others were improved over time based on priority. This can be seen in some of the notes above as I indicate what can be done right away and what should be done later.
Beyond MVP: revisions and additions
In addition to the revisions based on feedback, we created the following features in the 2nd iteration:
Role specific permissions
Create and edit rules for admin roles
Request rule changes for business users and the ability for admin to review/approve or deny requests
View Only rules for general users
Simplified color coded indicators
Tooltips, guides and listing of defaults to help with decision making
Graphs of projected inventory 48 hours out from a point in time at the fulfillment center (delivery)
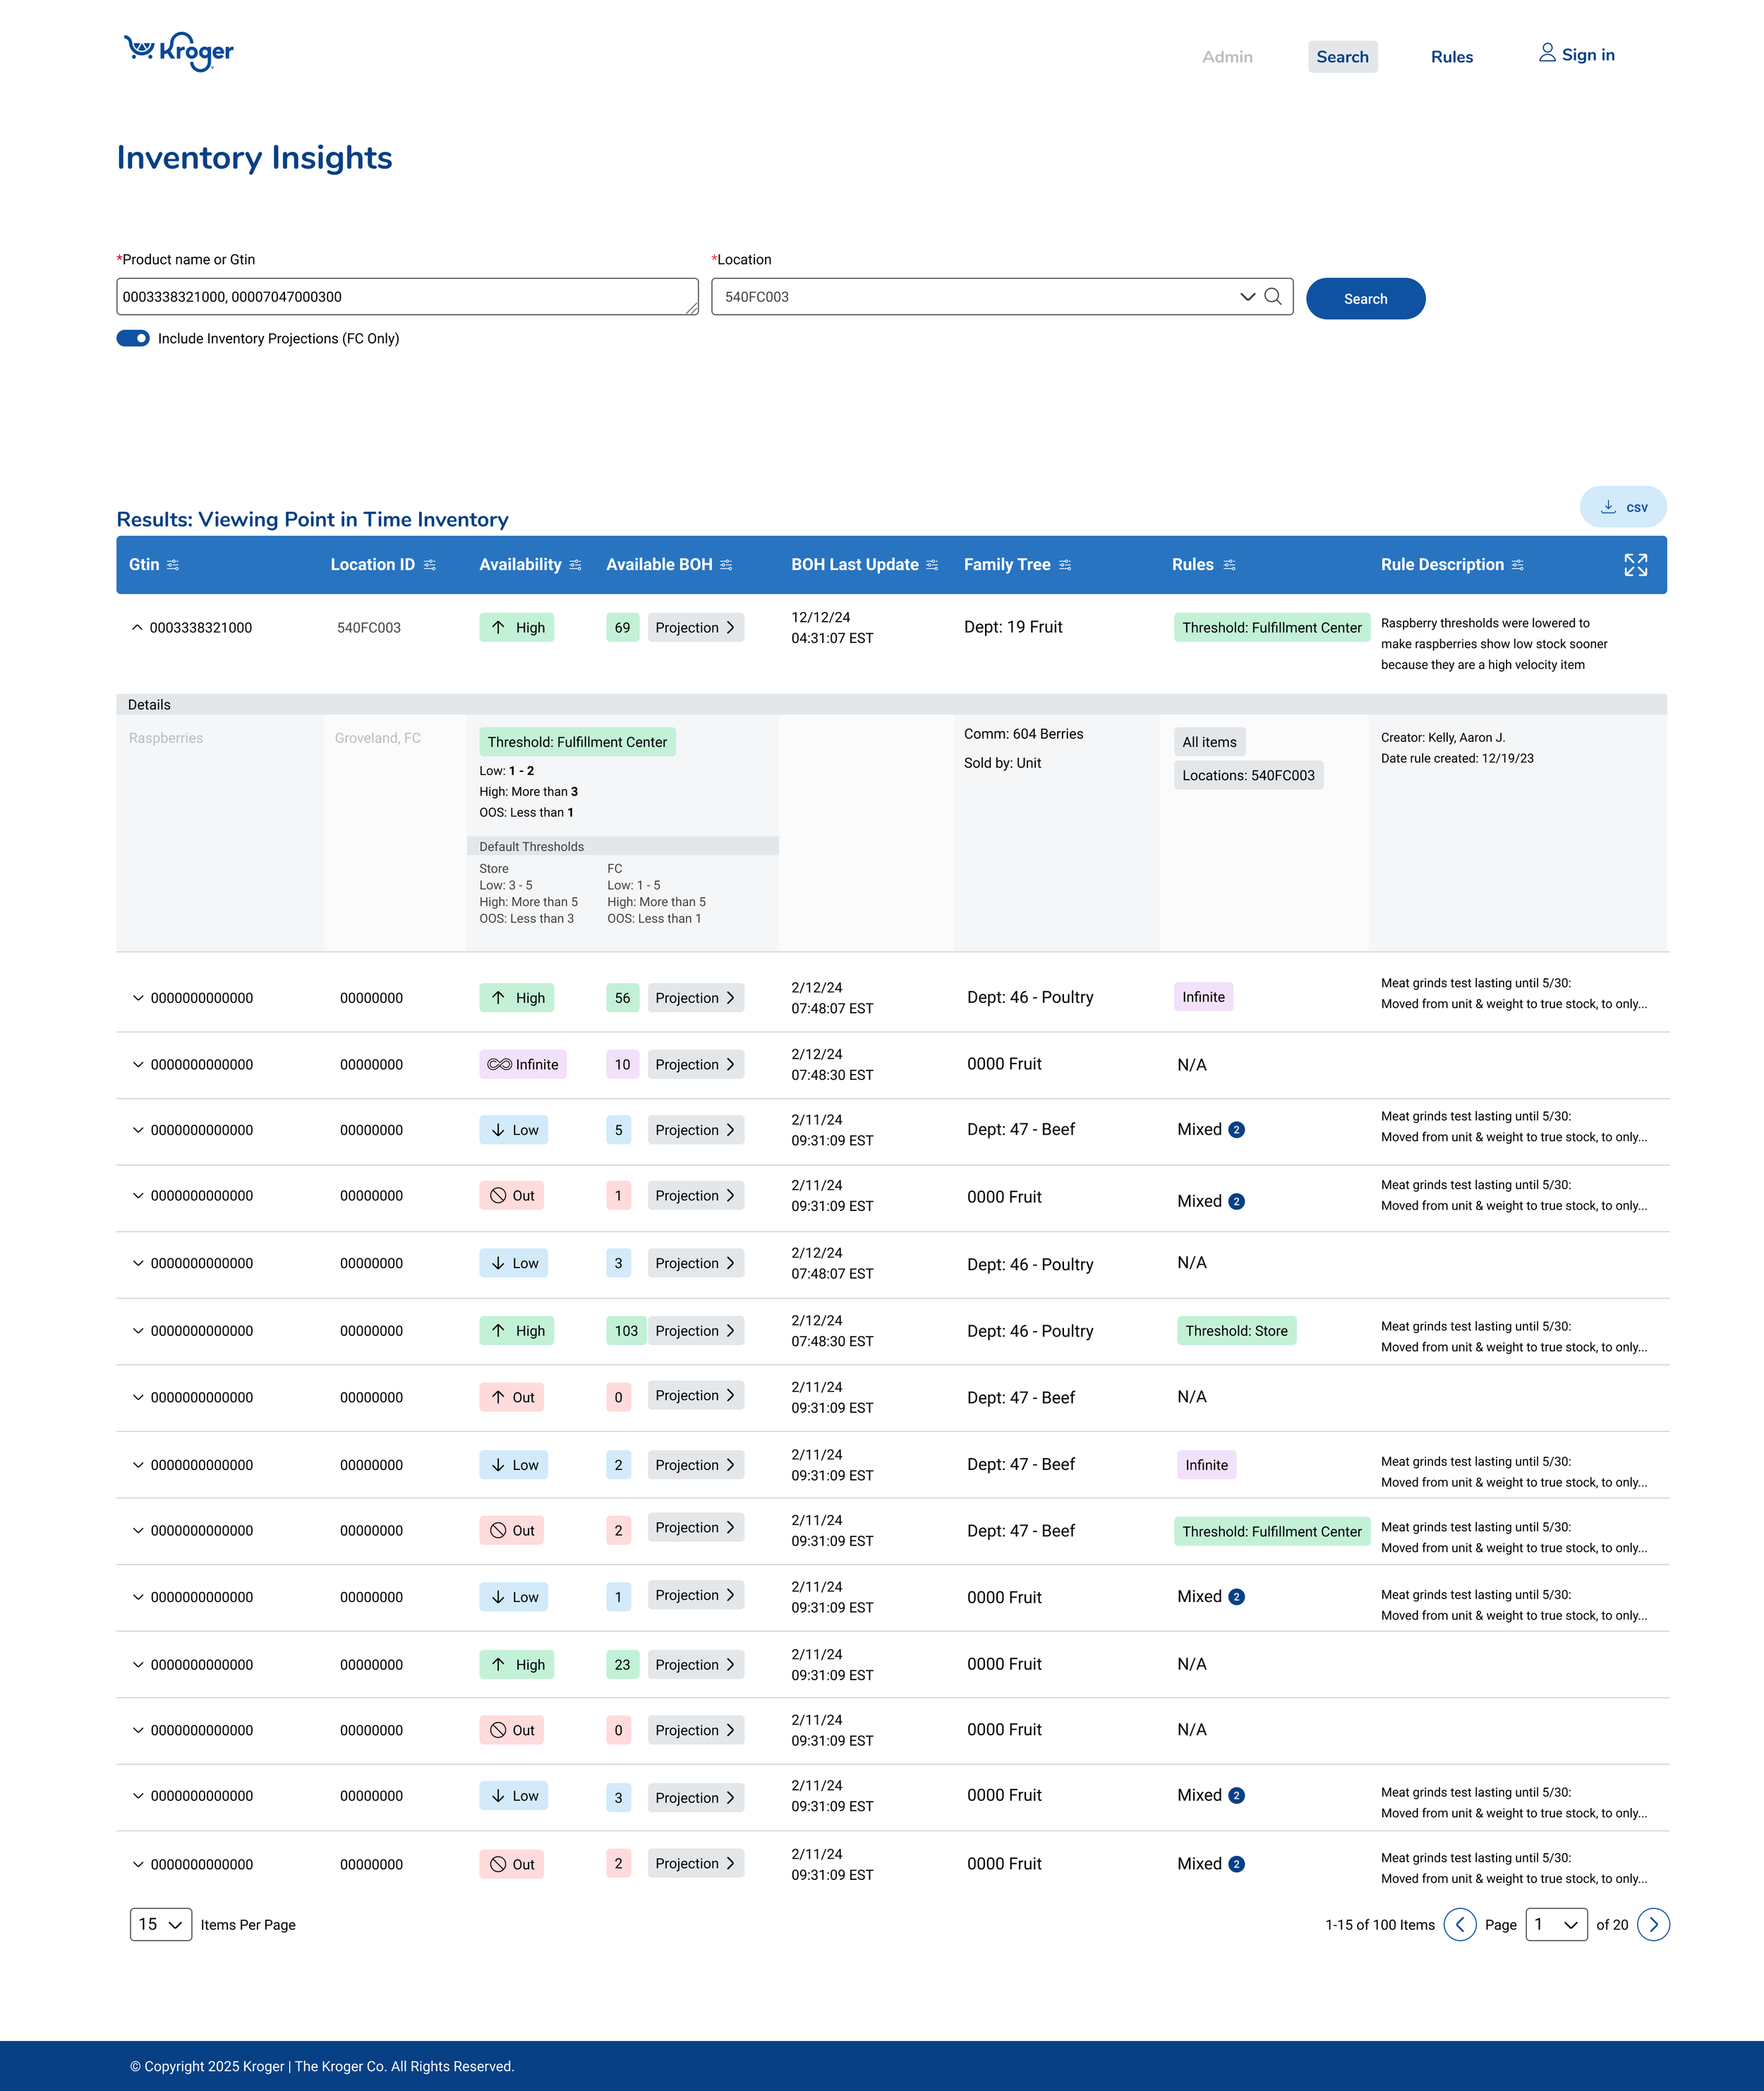
Inventory Insights with improvements
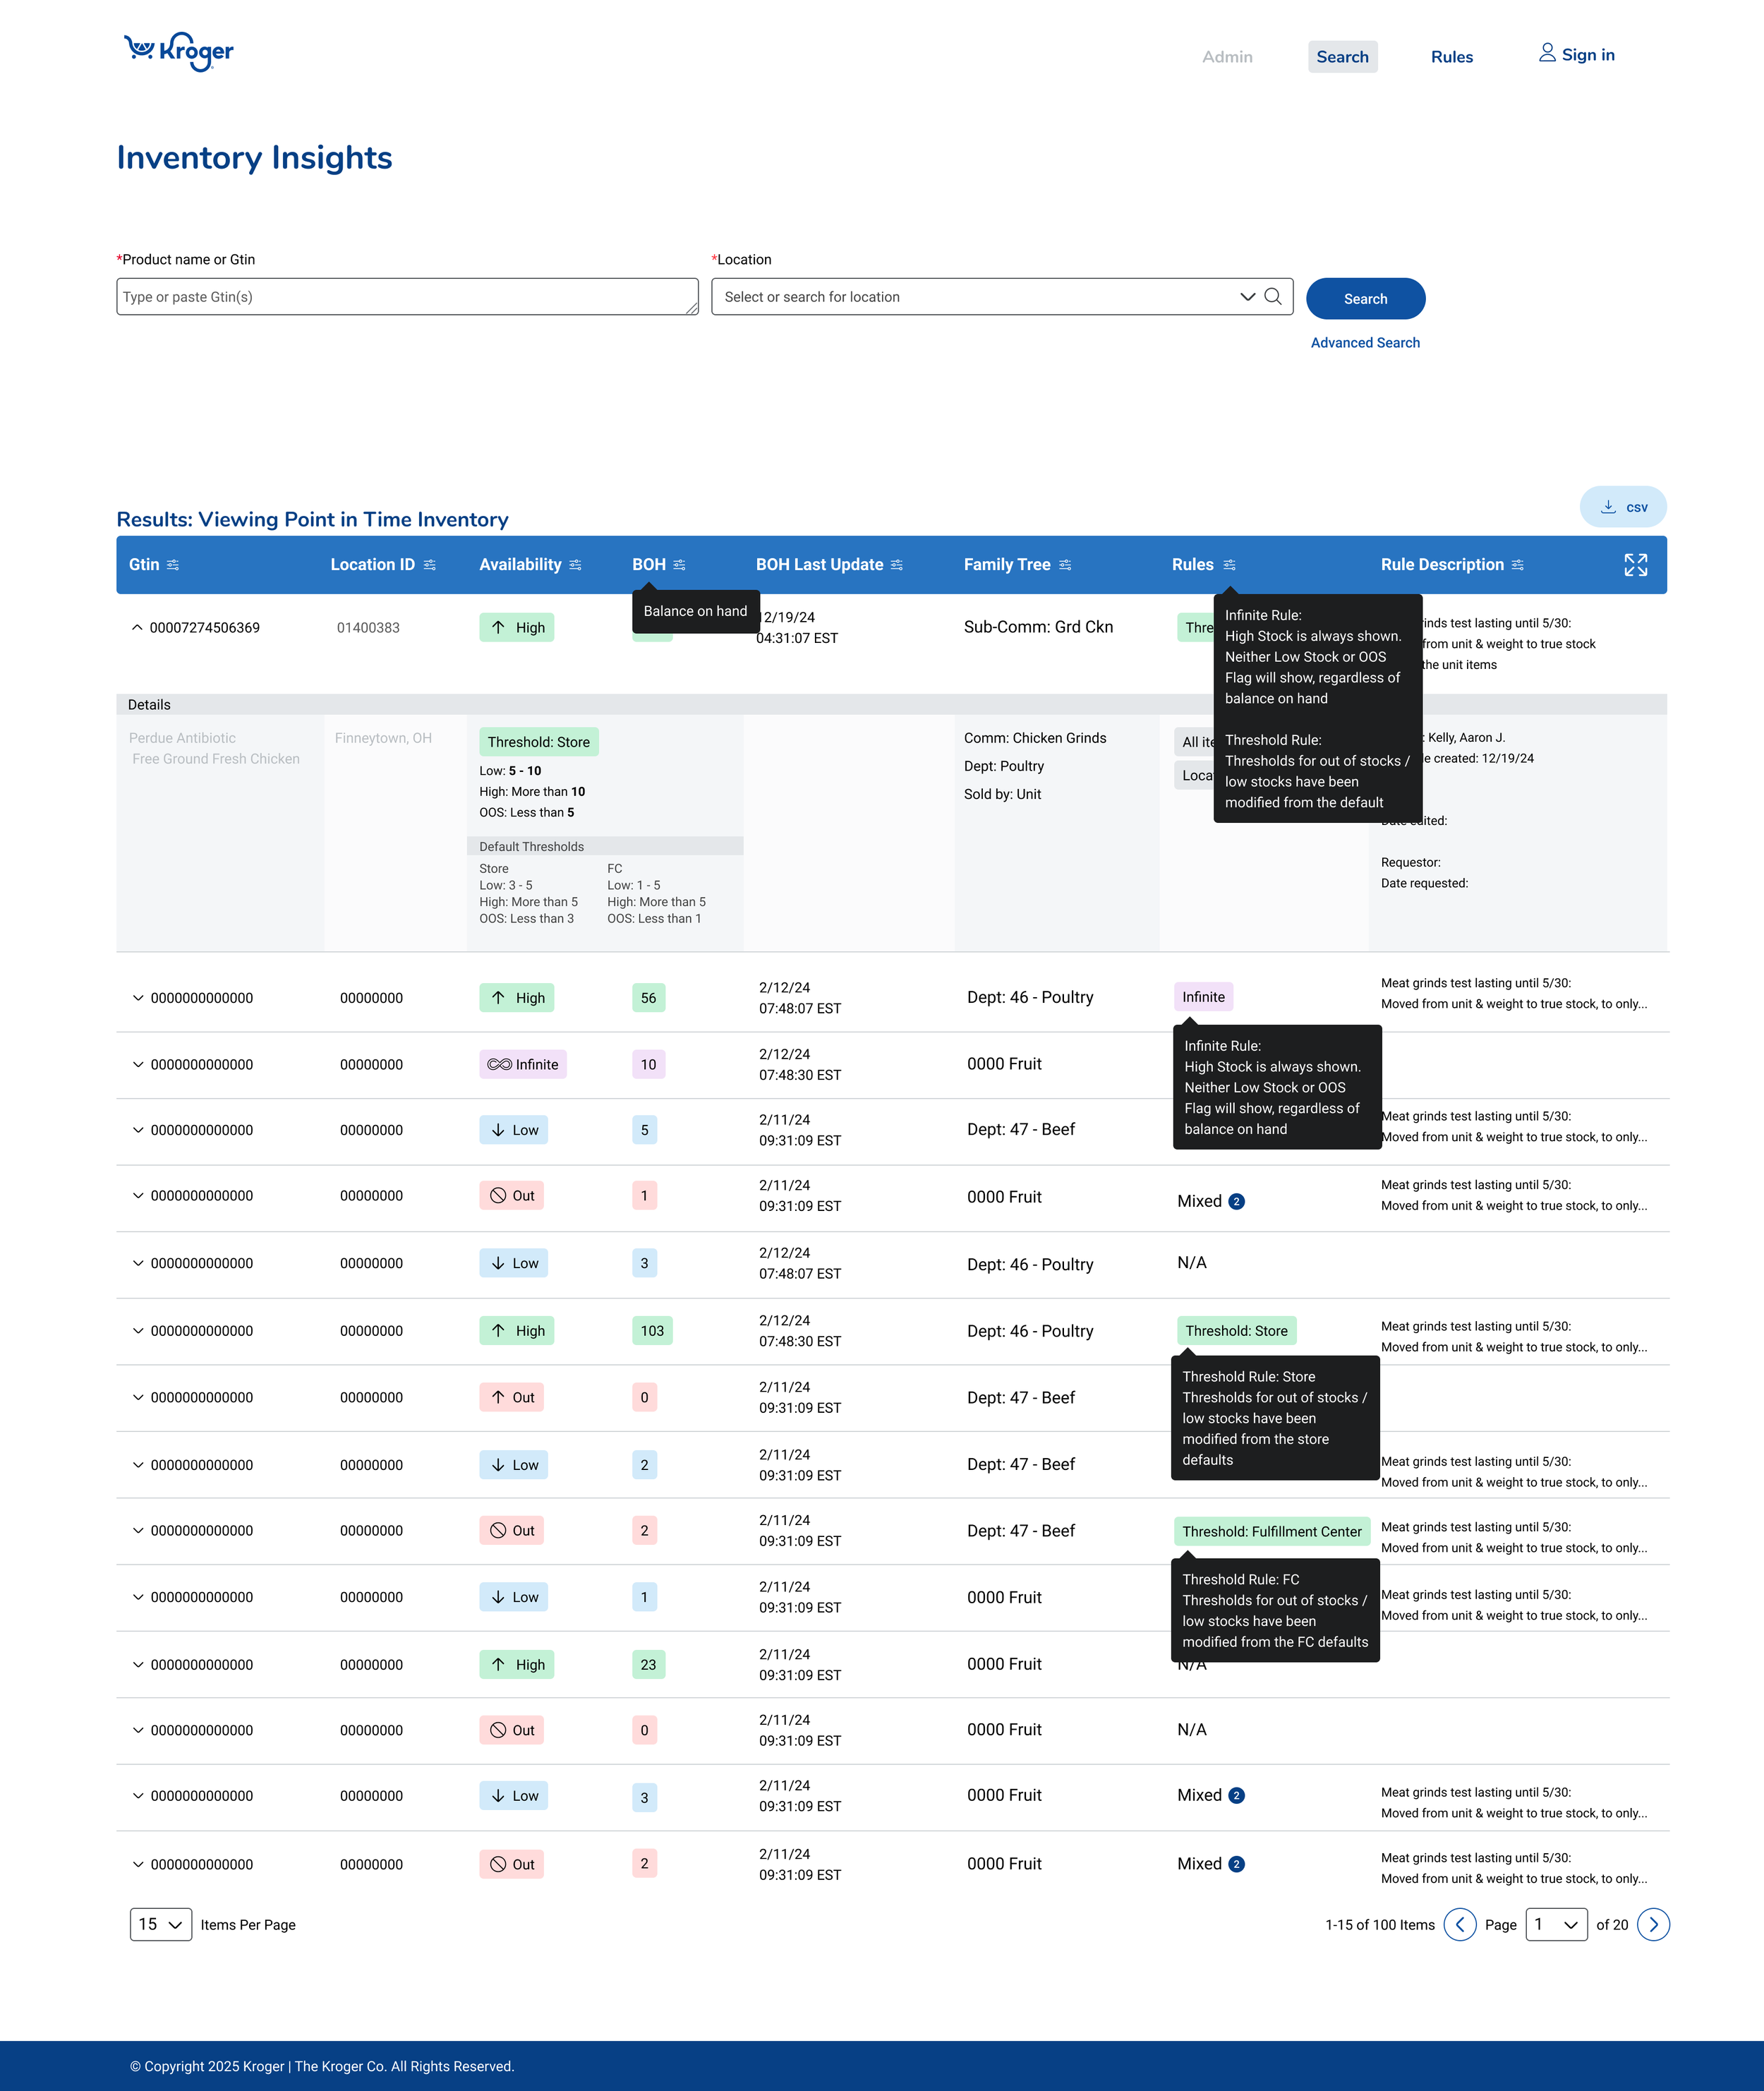
Tooltips on search page
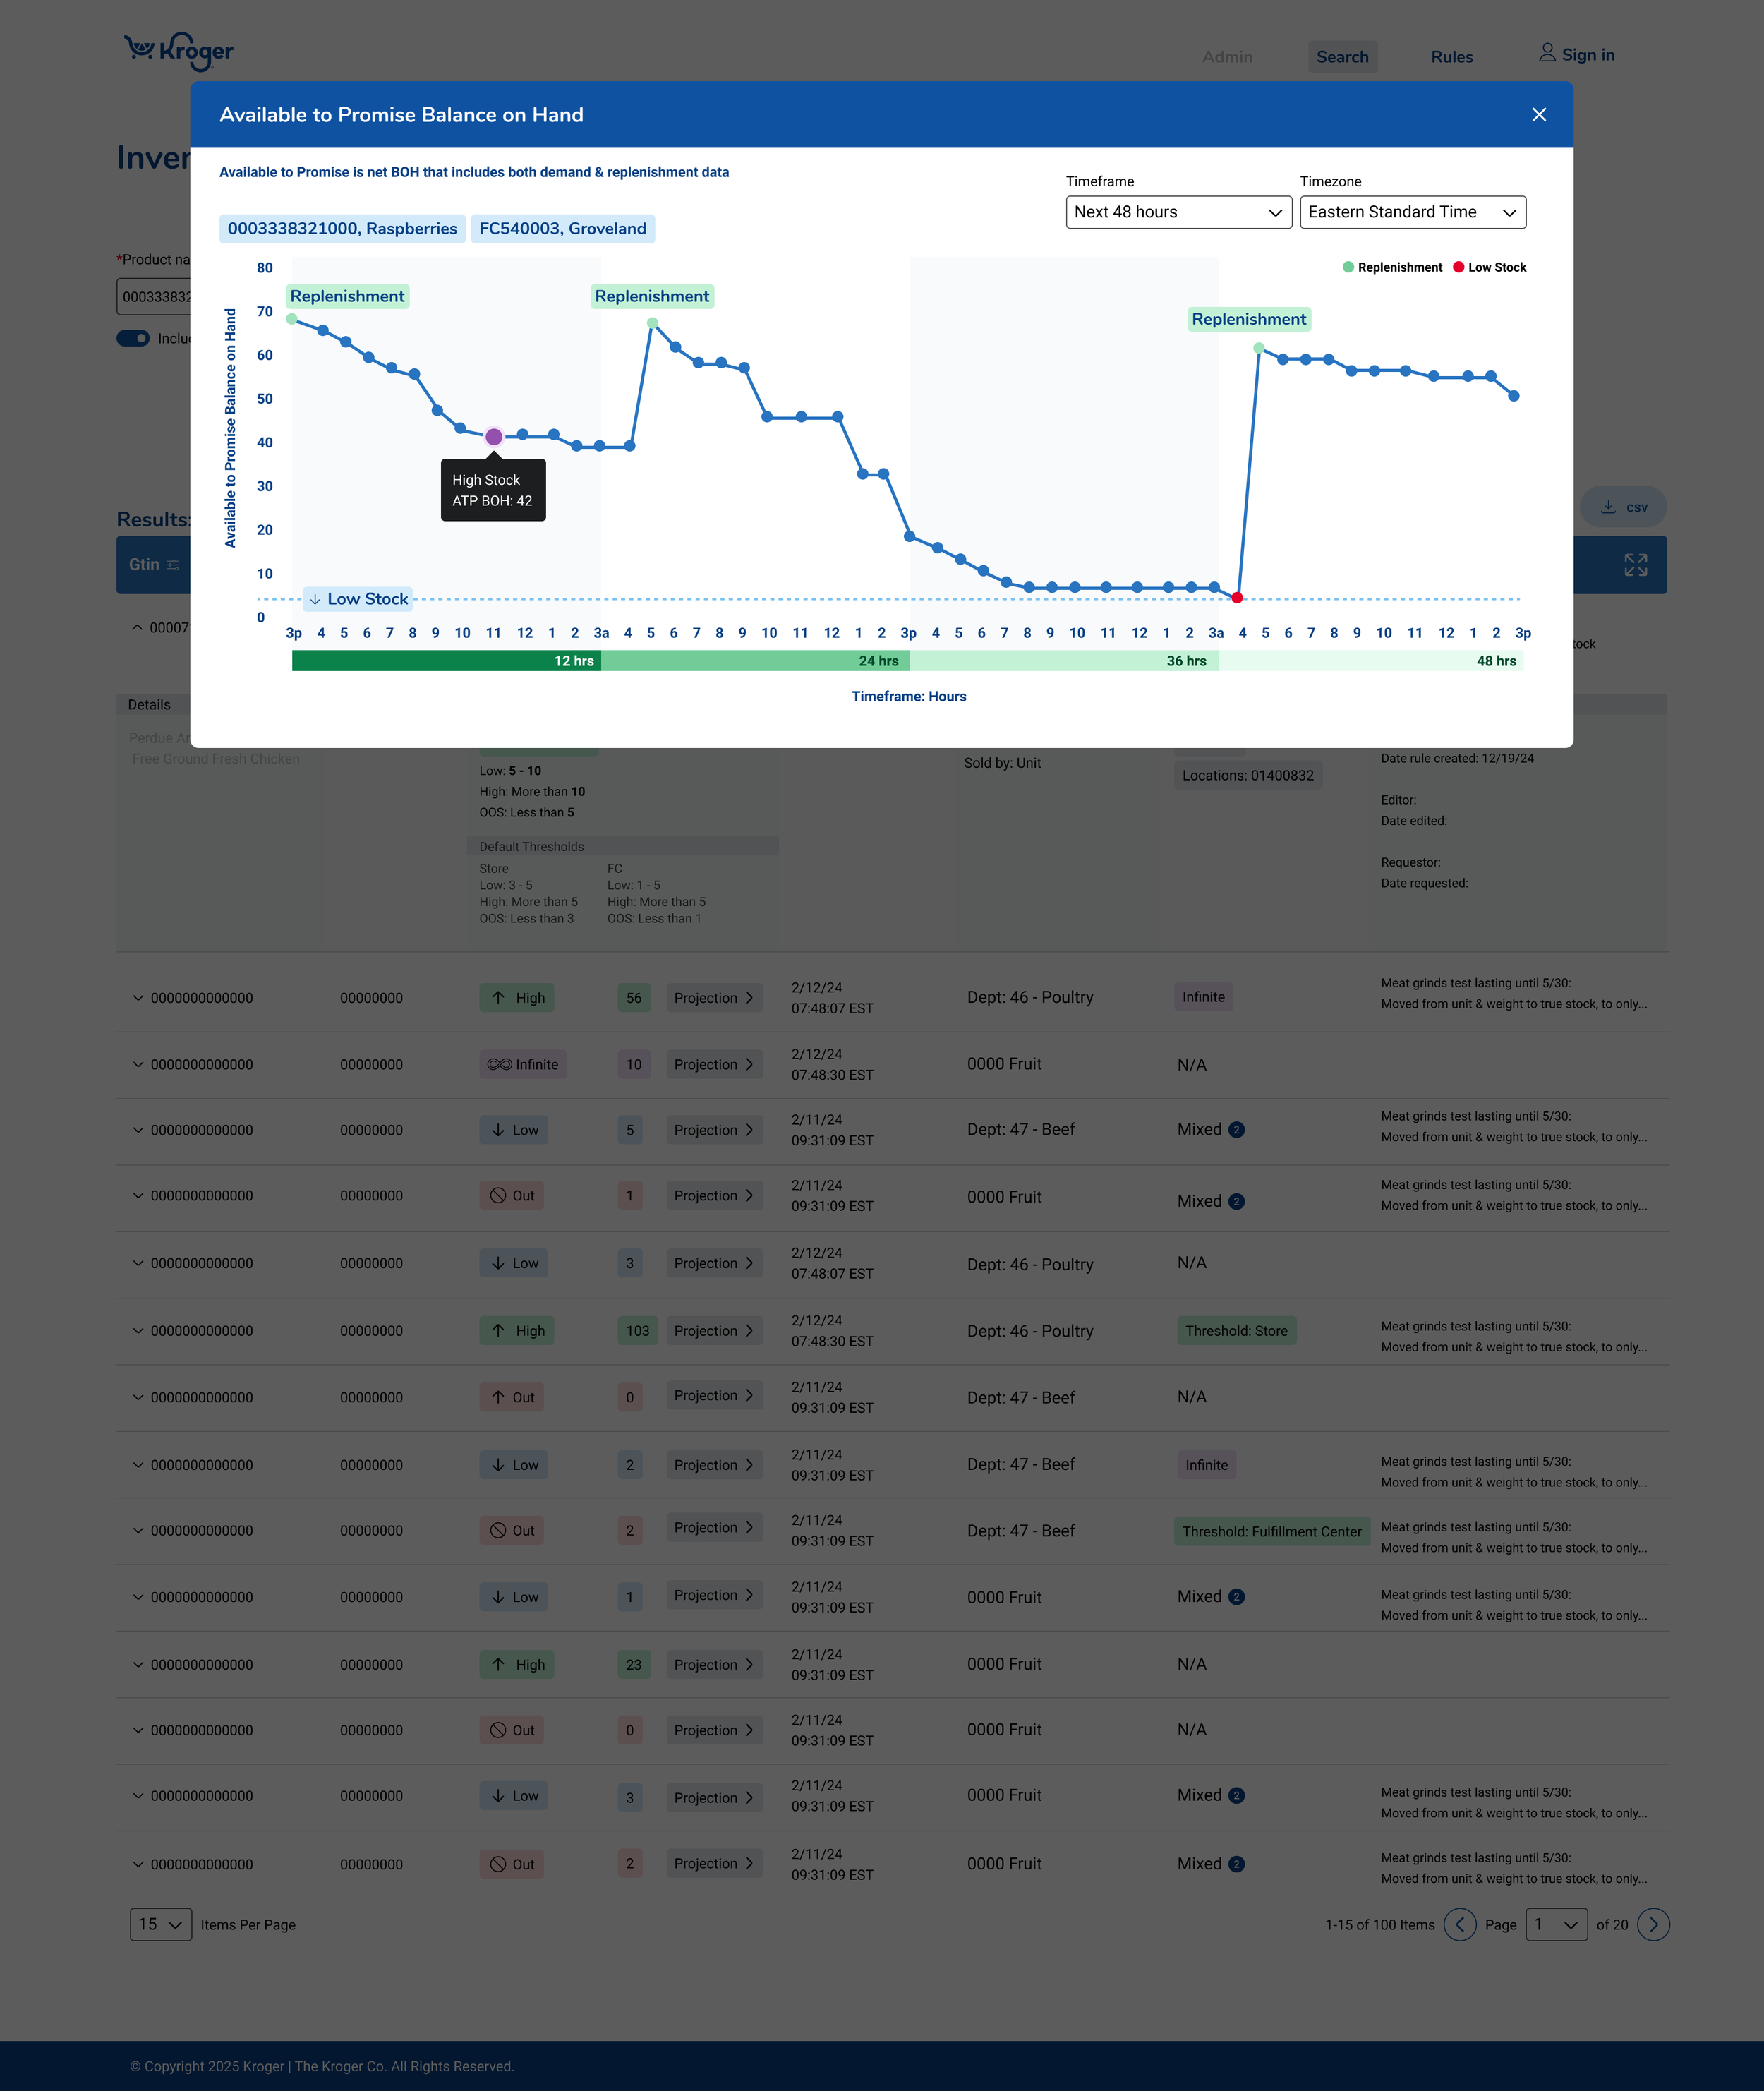
Graph showing how inventory will change for an item over a 48 hour period based on replenishments coming in and orders going out
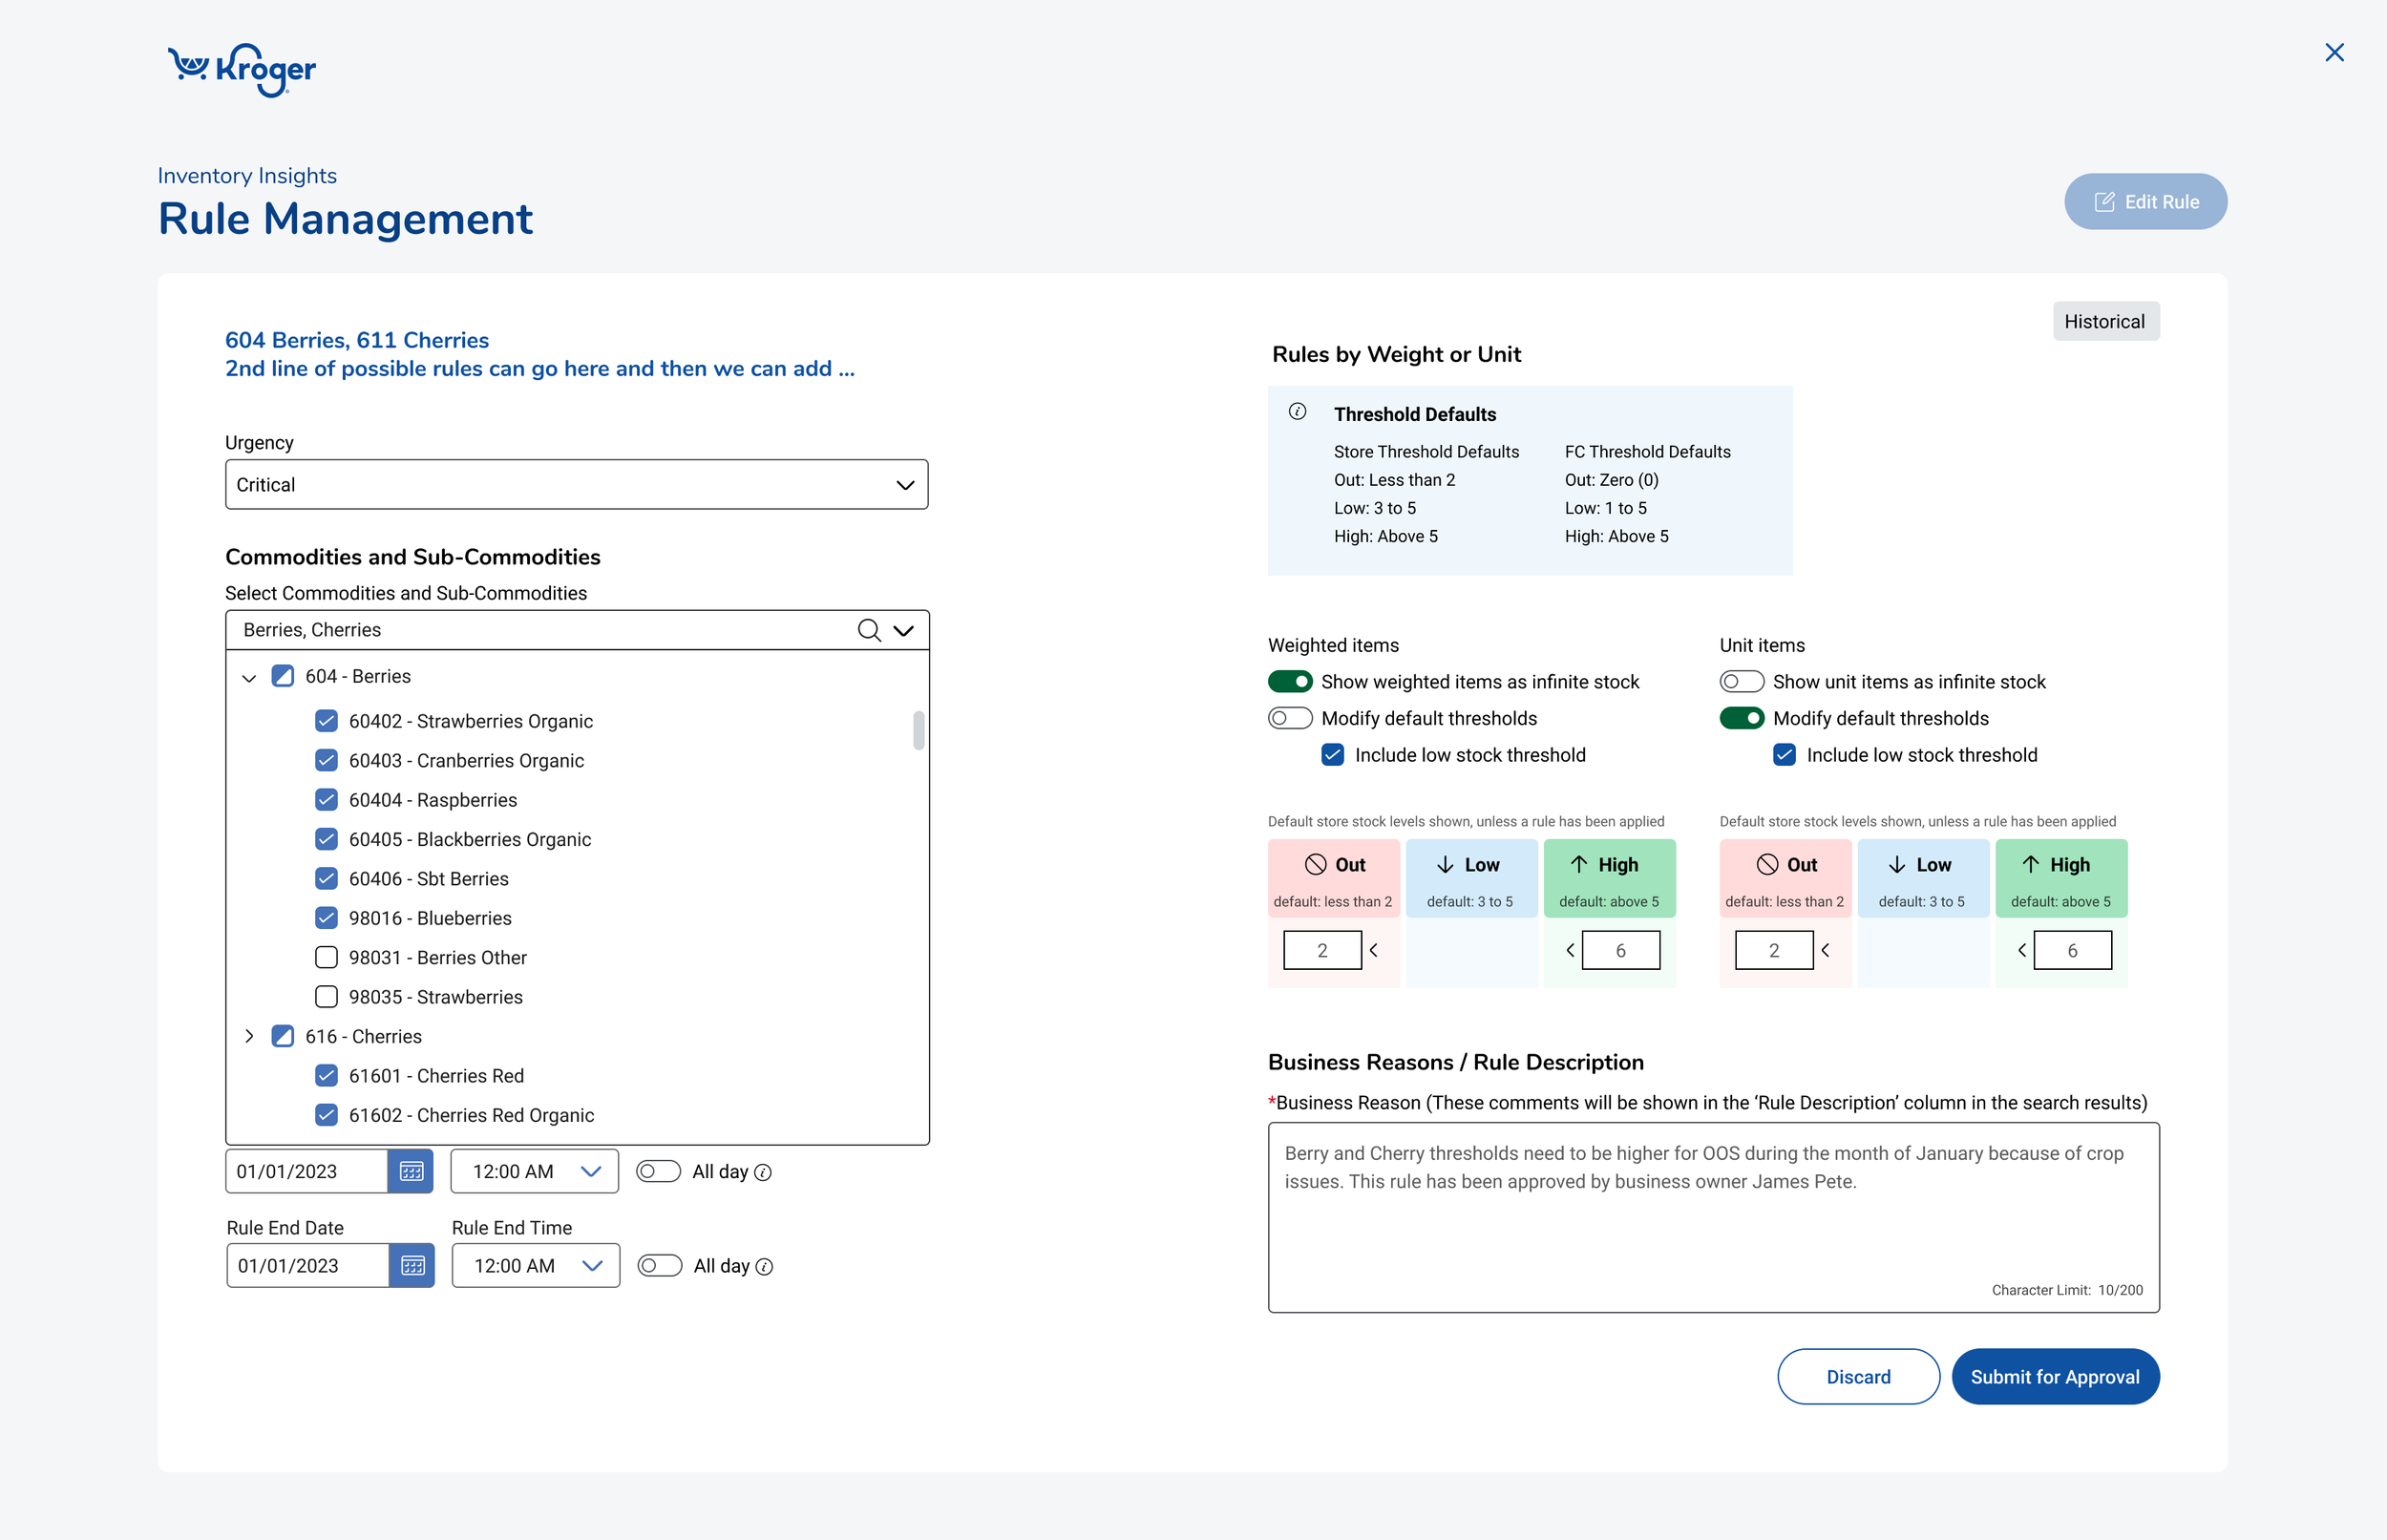
Business users can modify or create rules on this screen and send for approval
Simplified color indicators- no rules or rules applied and info boxes to explain rule types
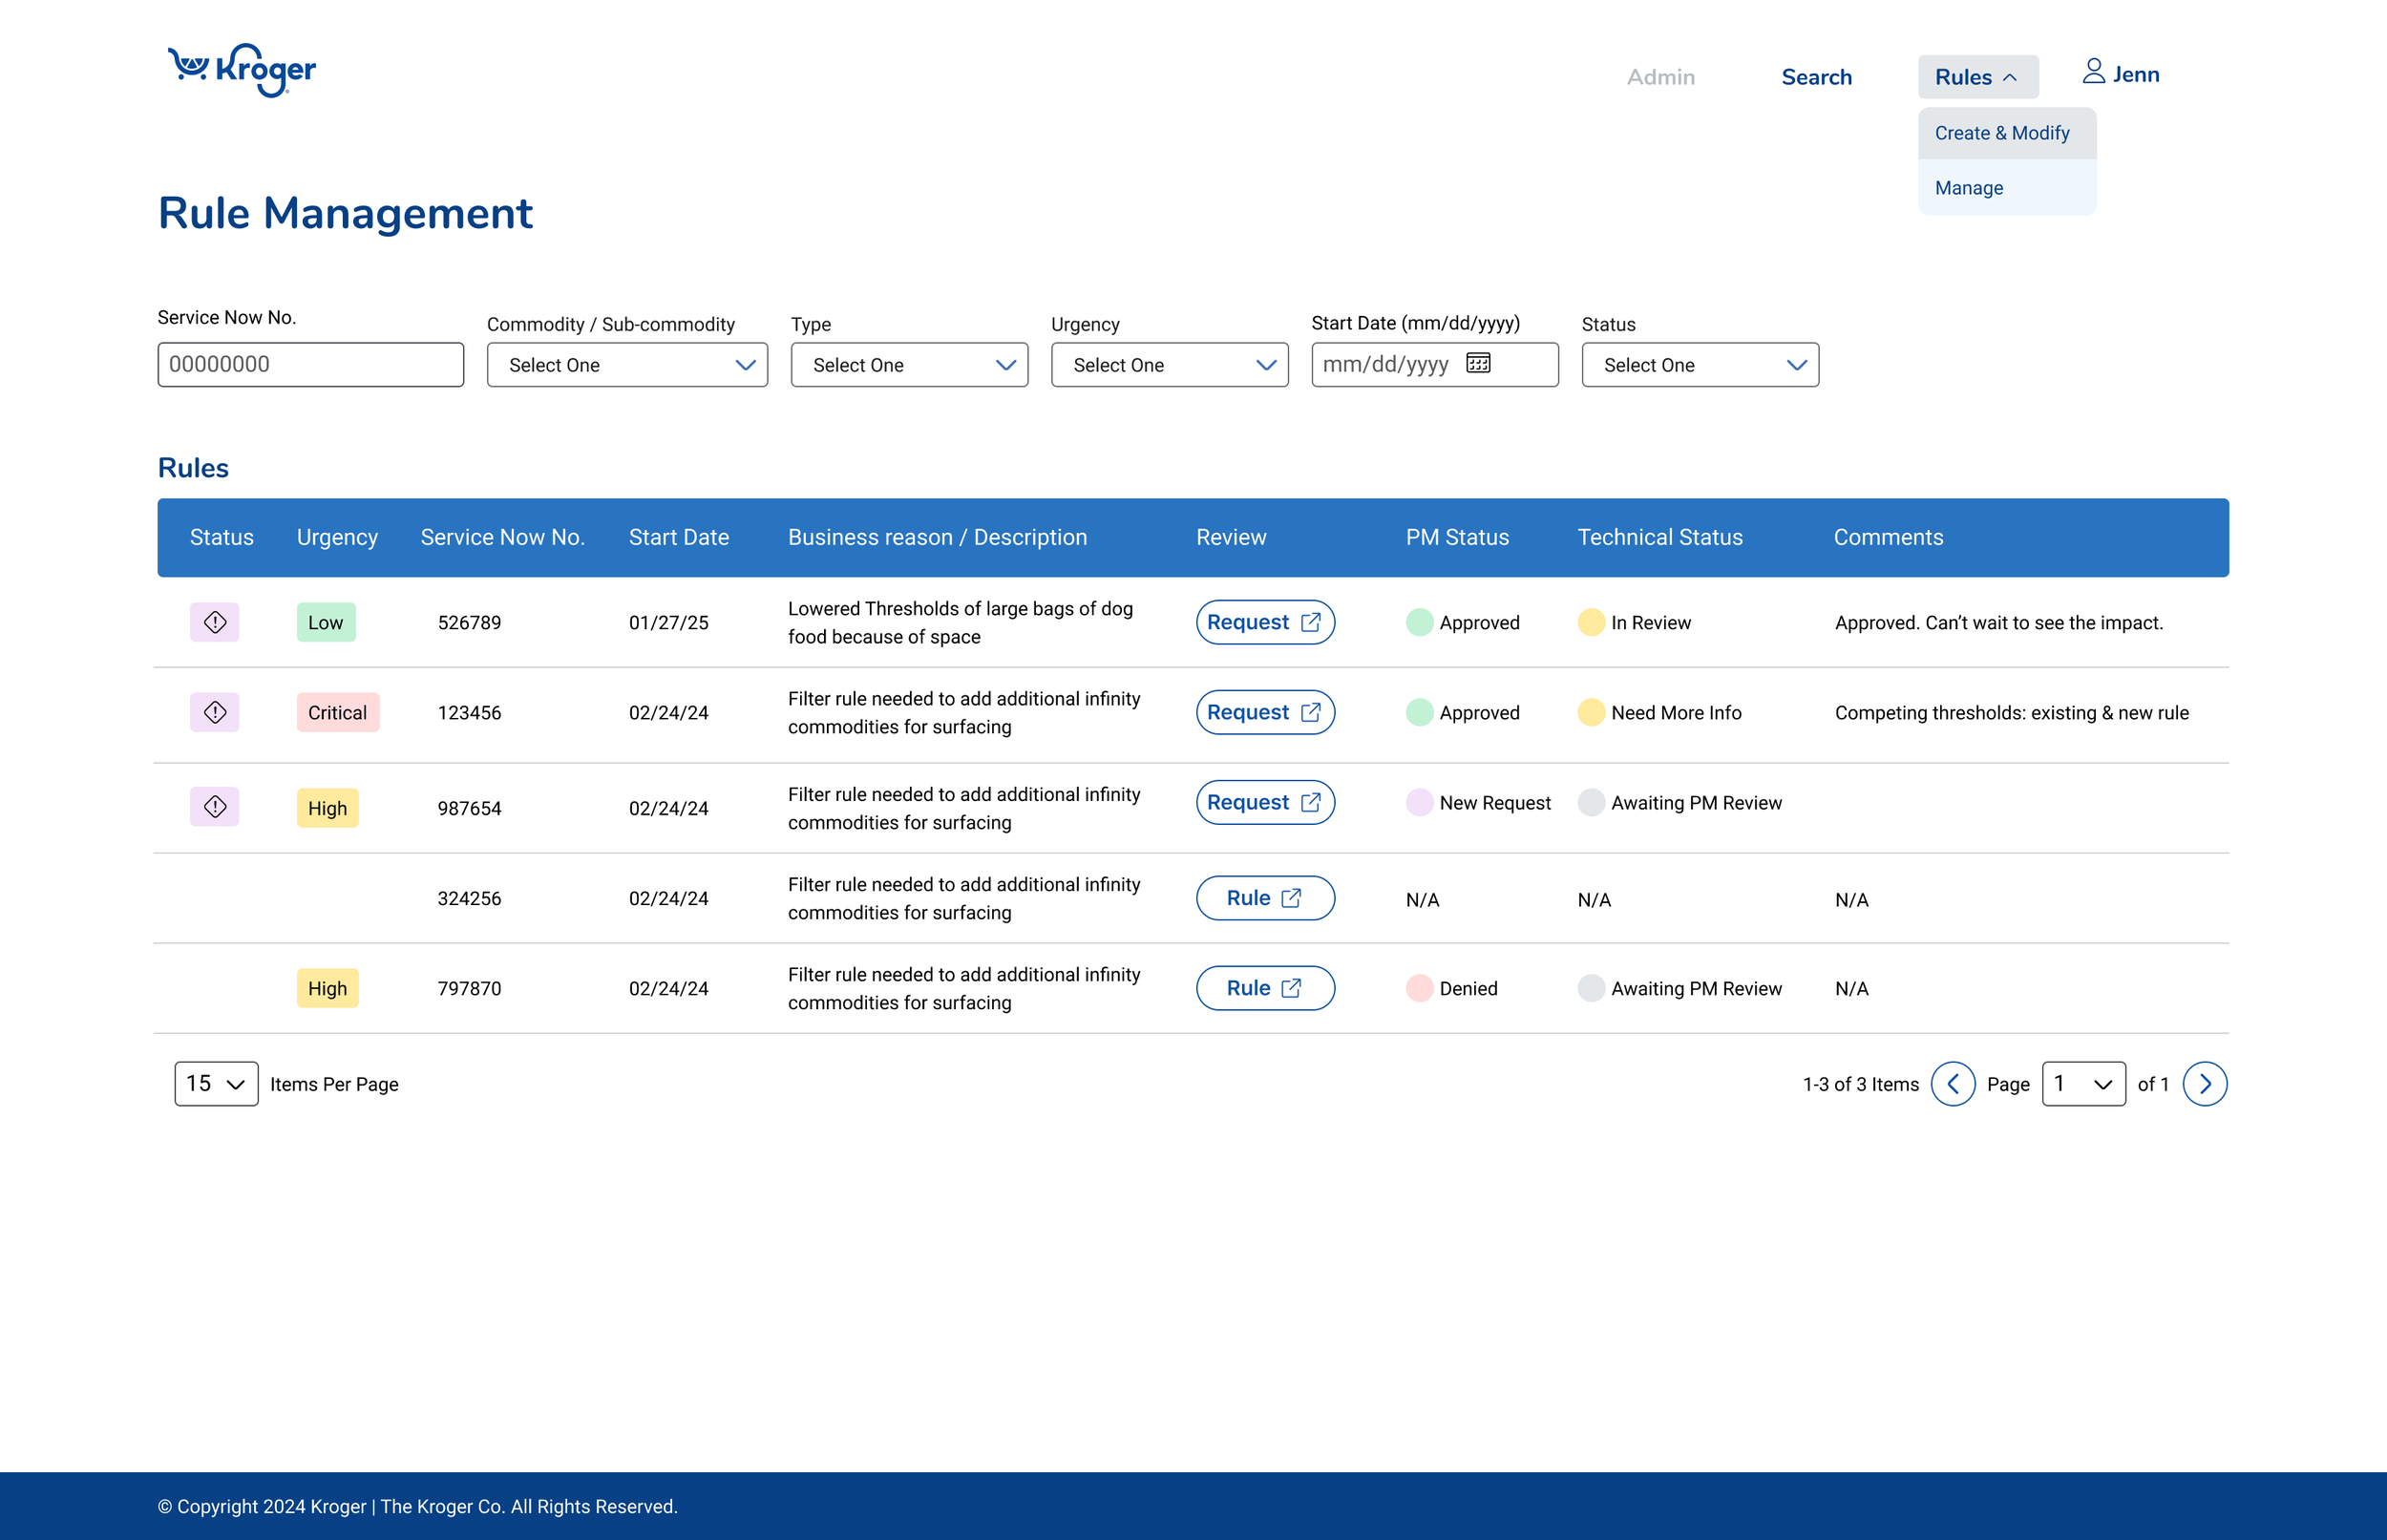
Rule management for admin roles to view, approve or deny rule request
Bulk data for reporting and dashboard
The inventory visibility team holds inventory data for the company. Many teams across Kroger need to access to this data and bring it together with other data in the company to see a complete picture. Our team had an initiative add our data to the bulk data interface, but first we needed to know what data was needed.
Initially the discovery was to find out what data needed to be added to the bulk data interface. However, as the team was reviewing some of the reports from our users, we realized that we could build a better report for our business users to determine what and why items are out of stock.
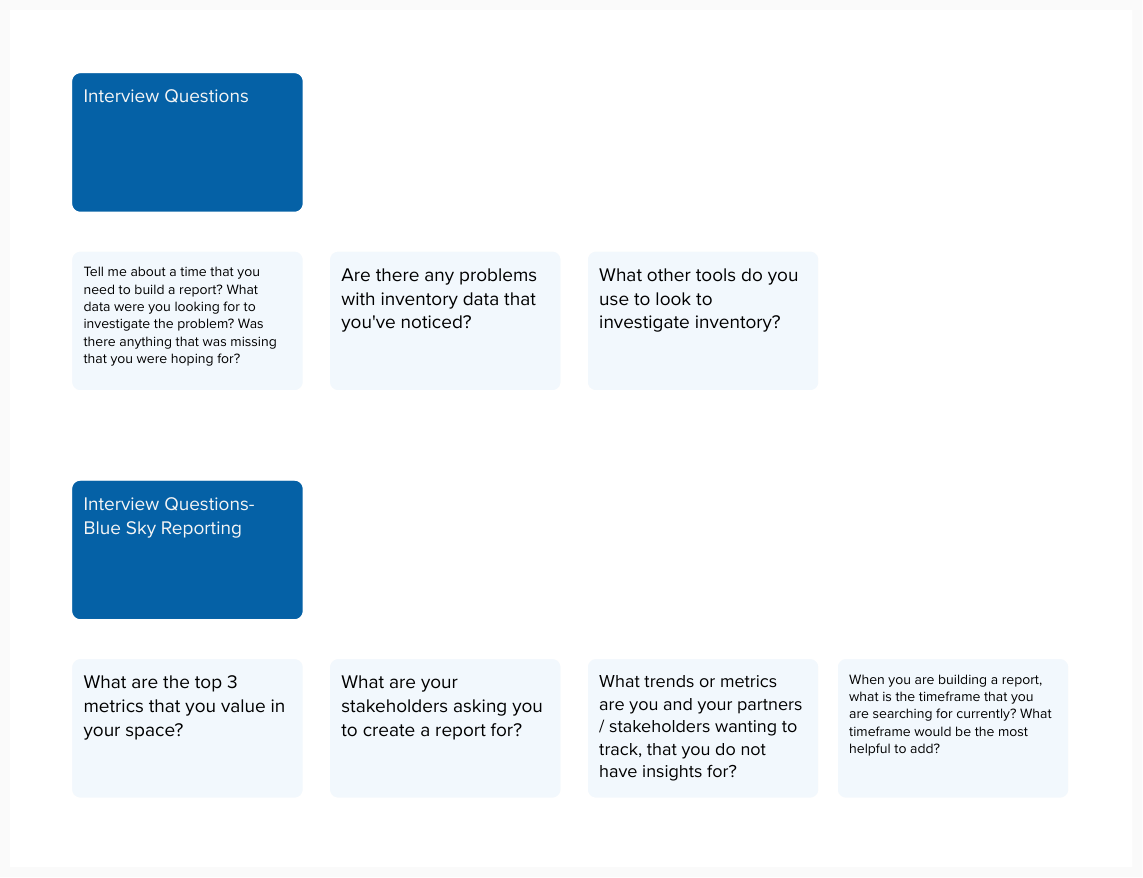
Interview questions
Interview documentation
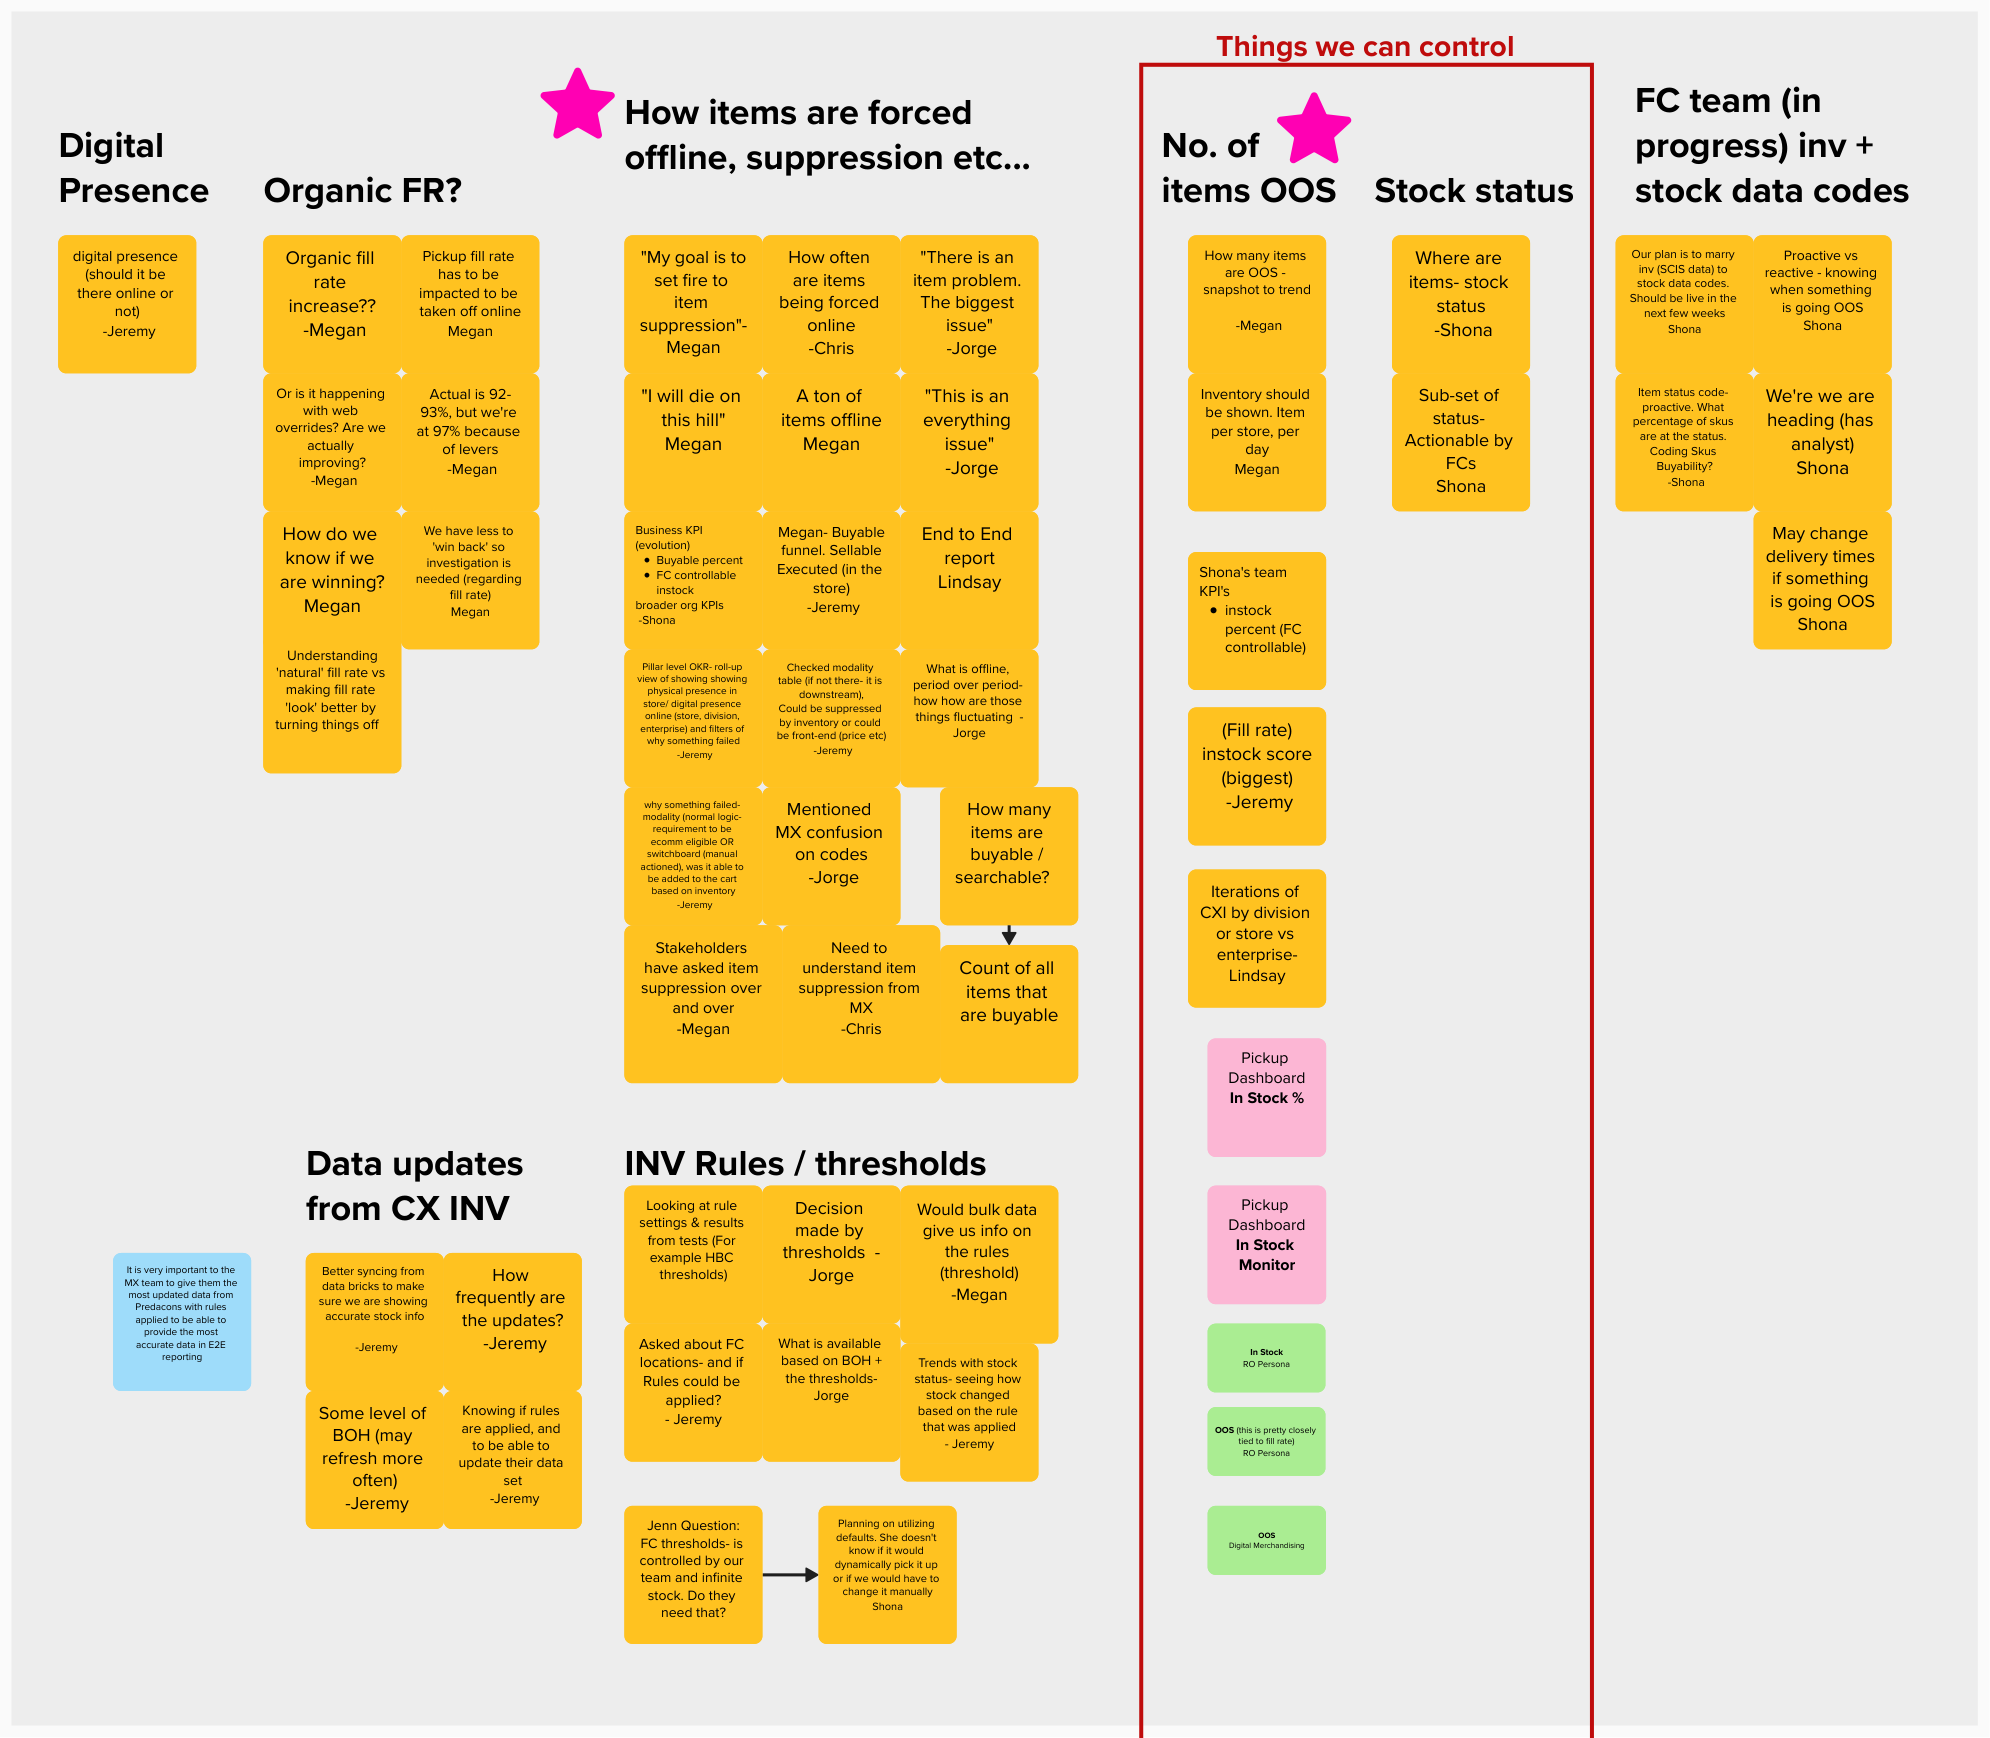
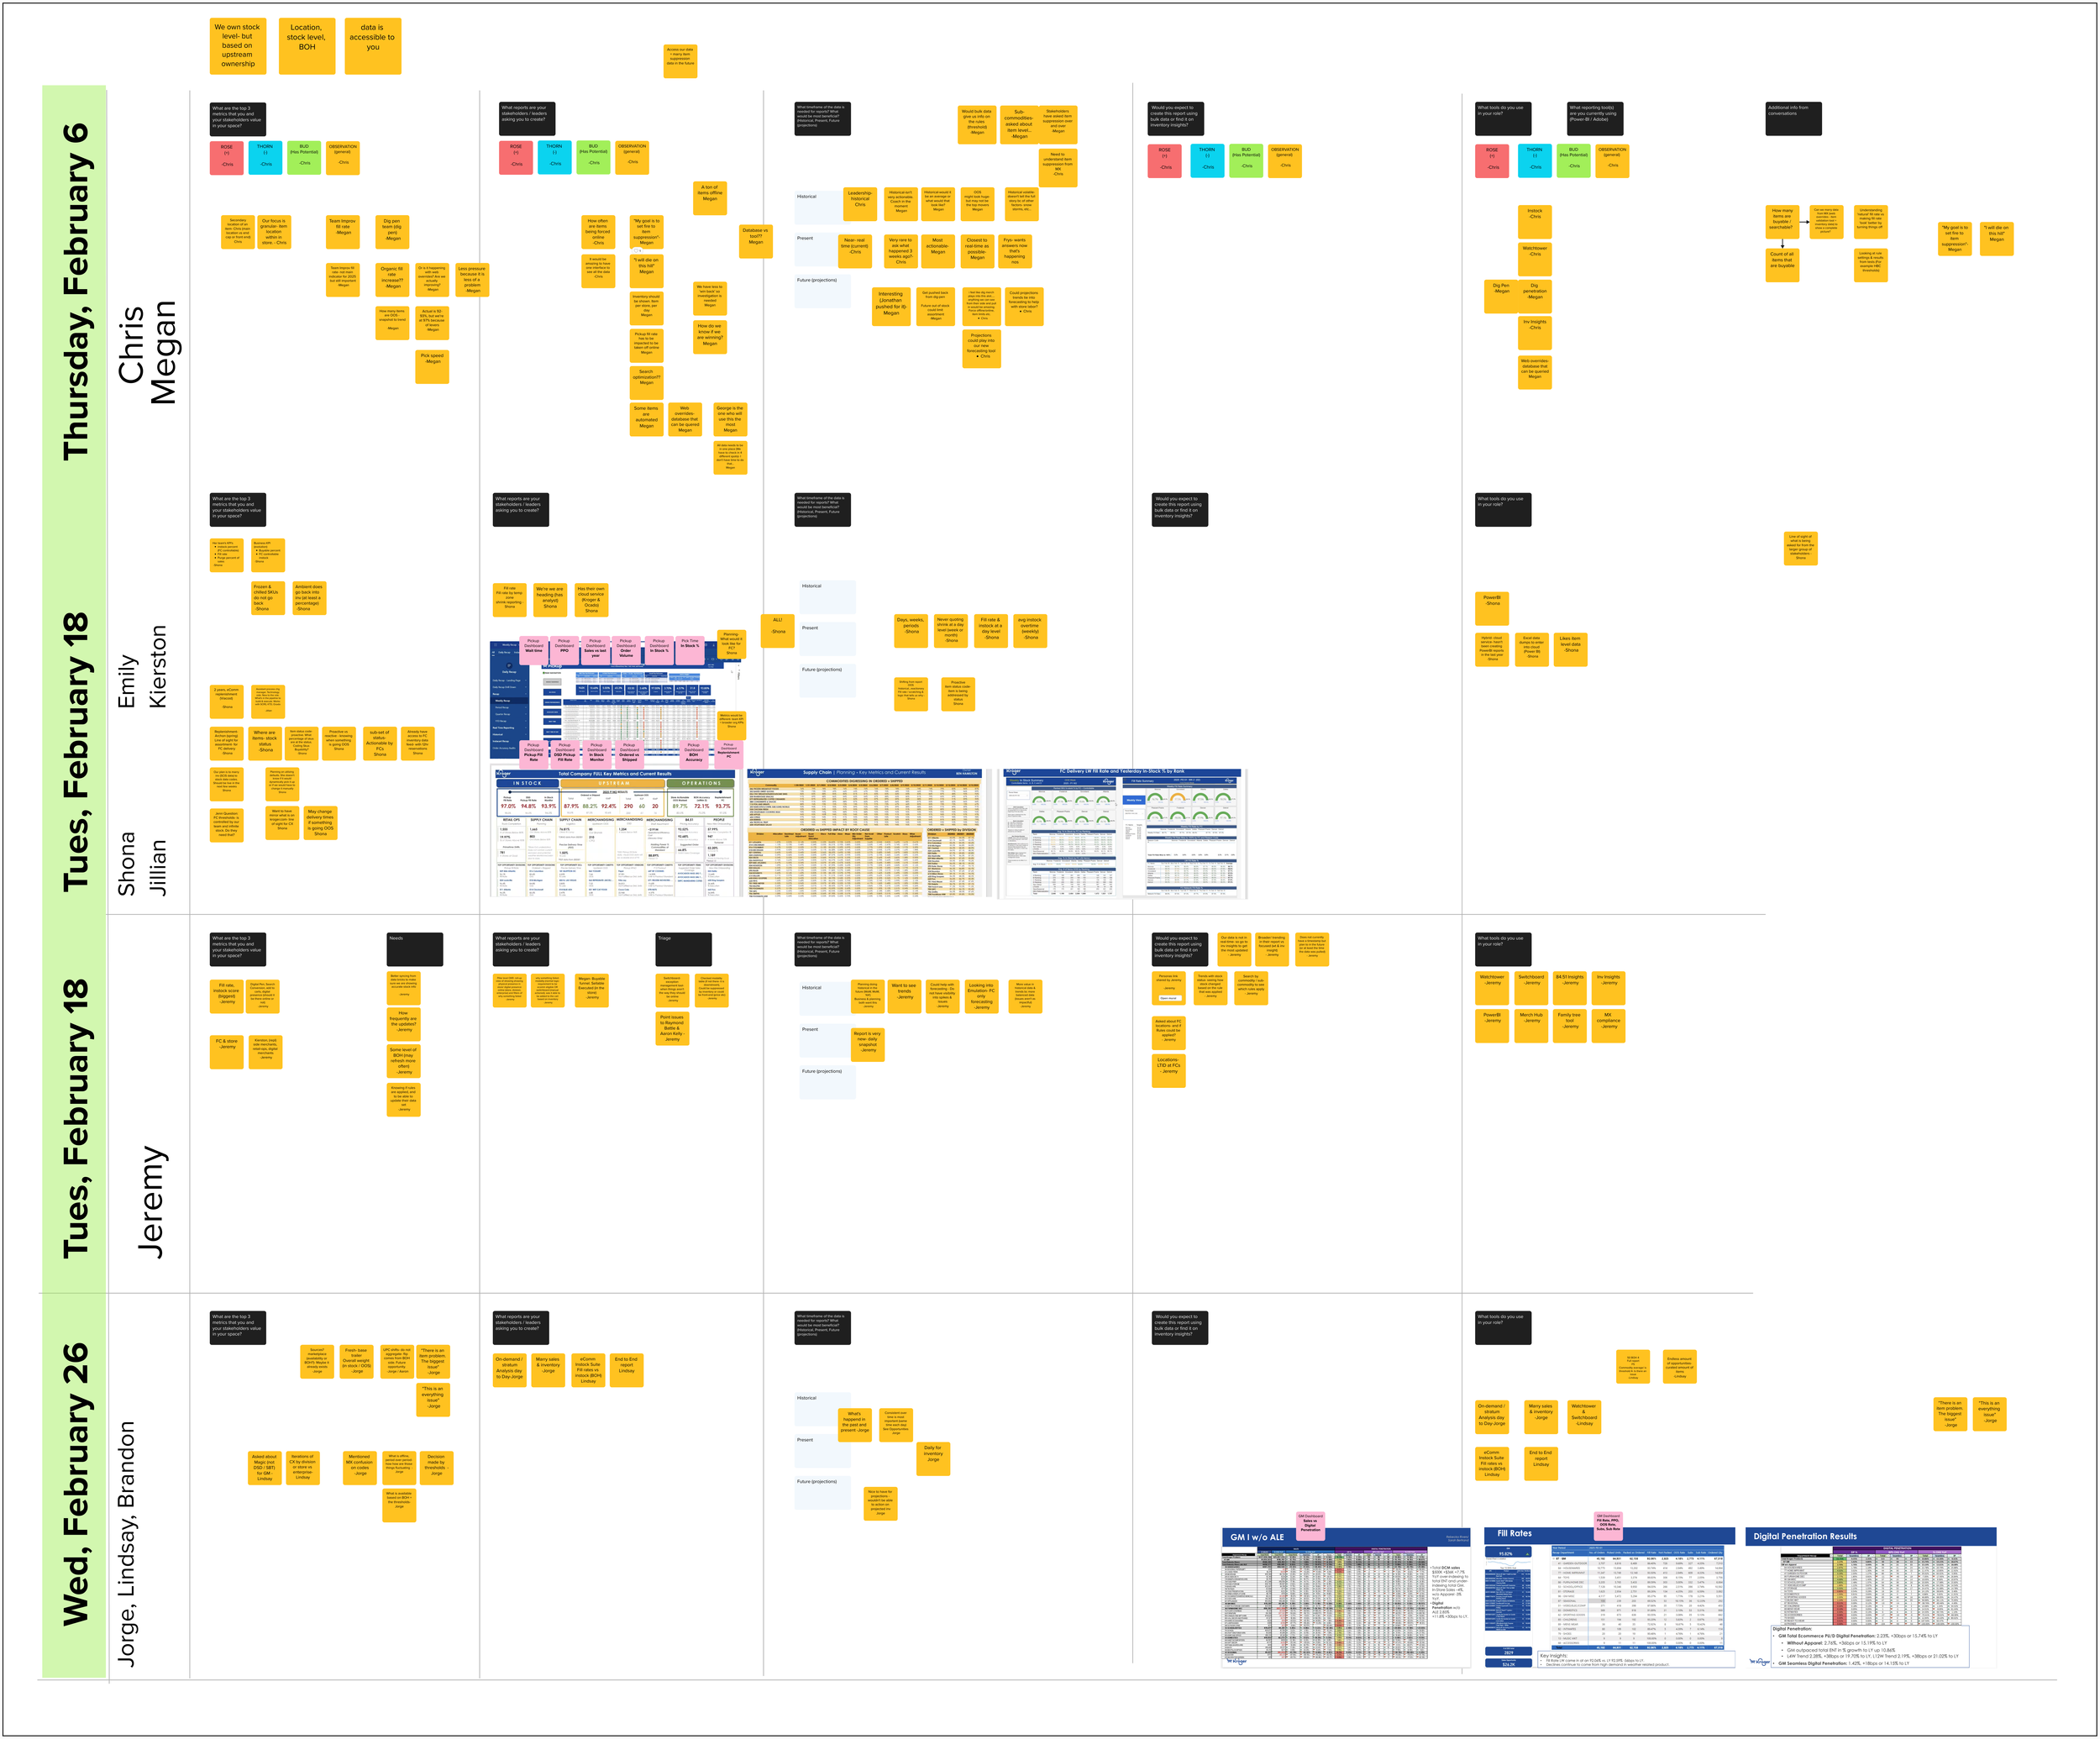
Analysis of interview notes
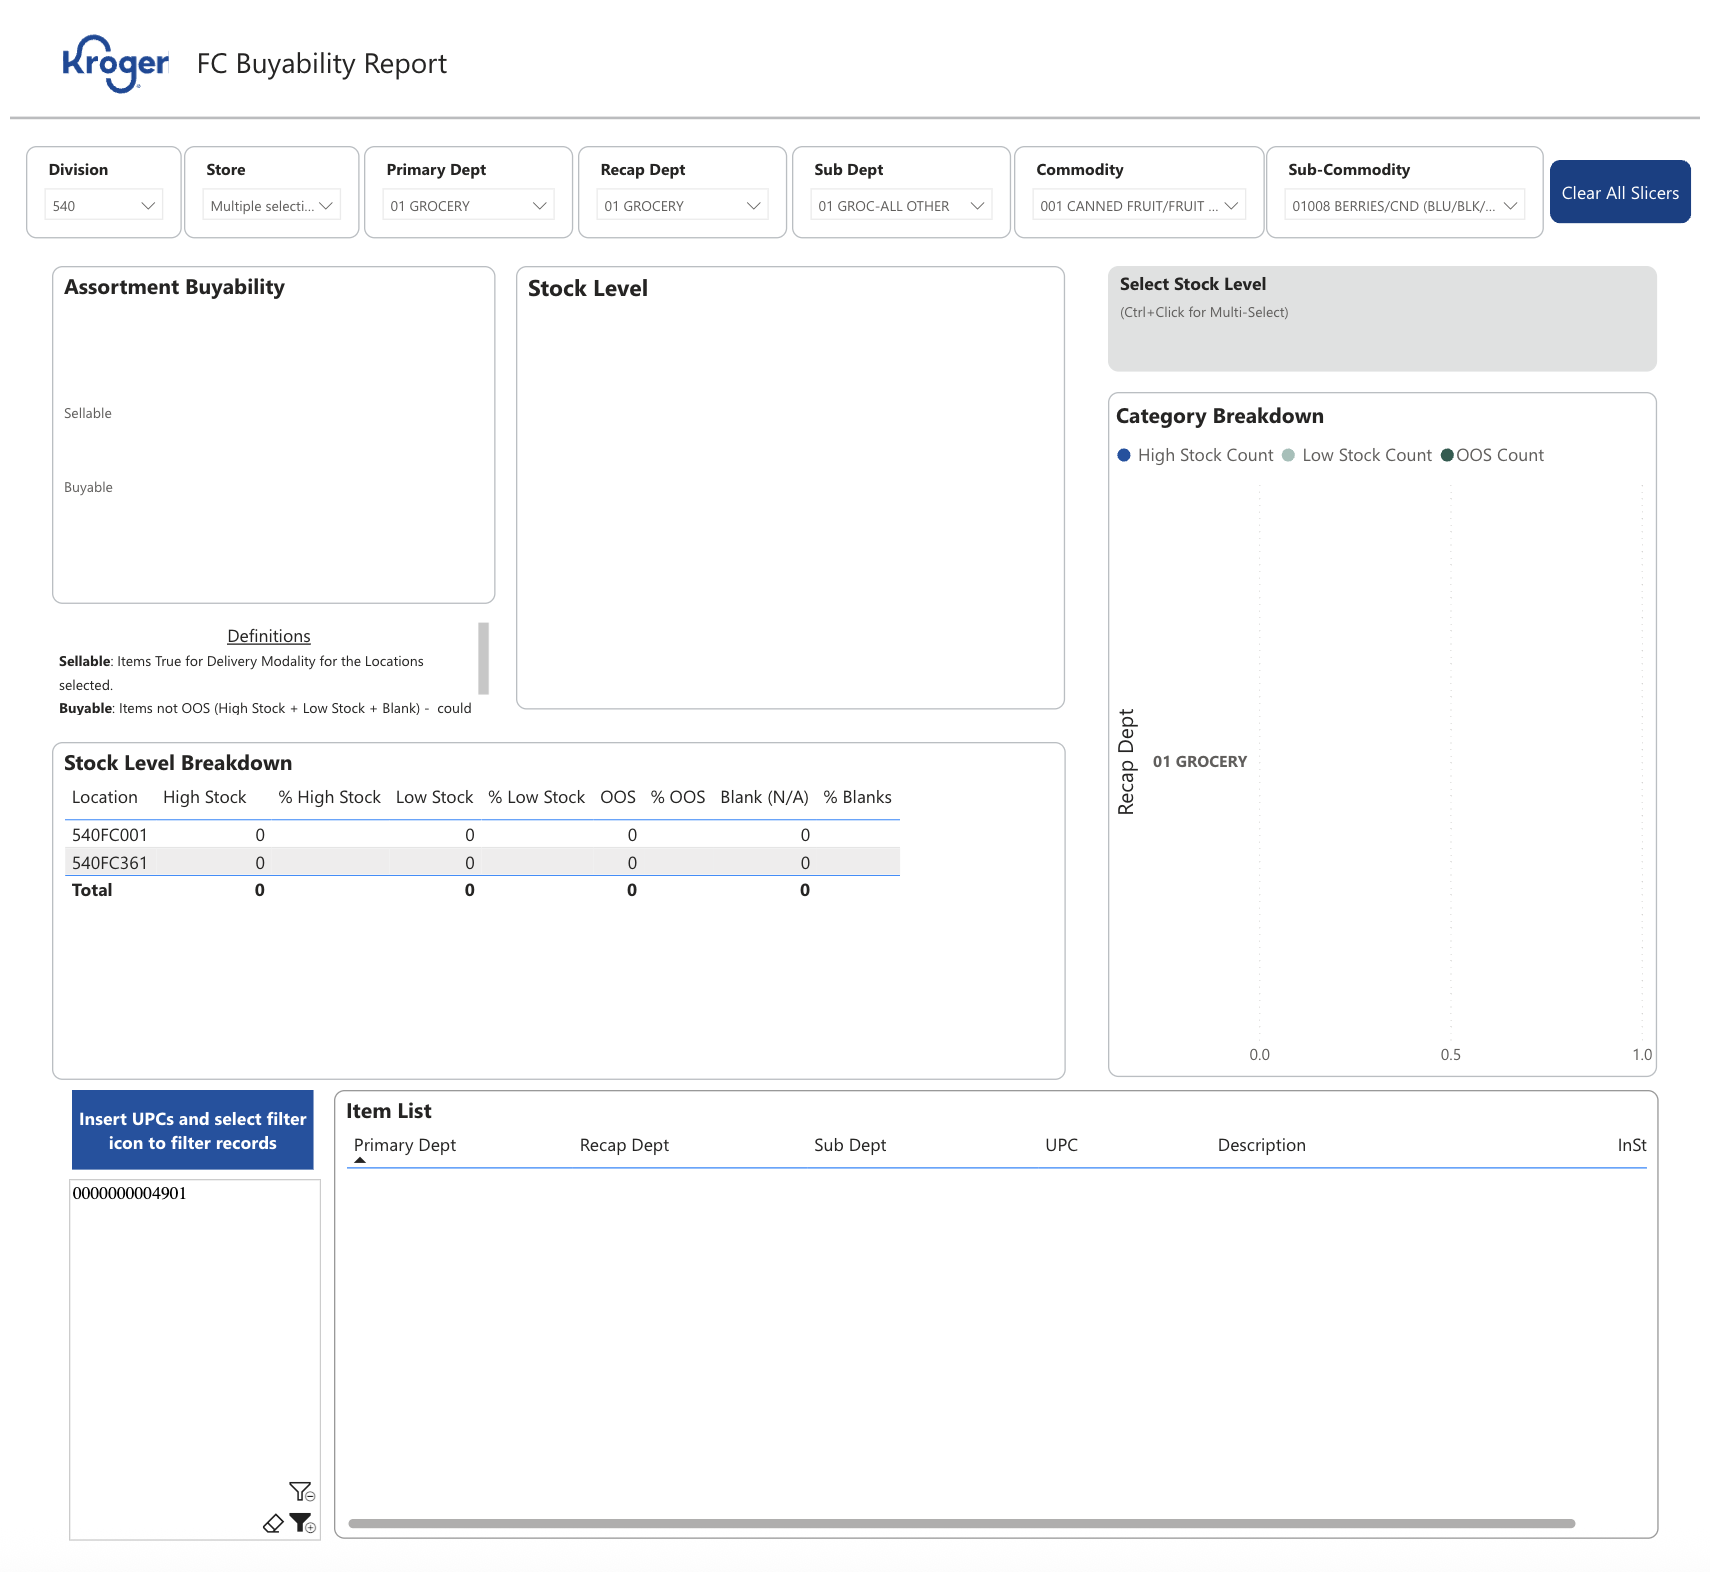
Example of an inventory report that is used by business users that could be improved
Data Timeline:
Present
Historical
Projected is seen as a nice to have
Tools:
Their own dashboards / reports (PowerBI & Cloud Reporting)
Watchtower
Inventory Insights
Switchboard
Findings from interviews. Data needed for bulk data interface
Top Metrics:
Understanding how items are forced offline from various teams / areas of the business
OOS (stock status)
Fill rate
(Sales also came up frequently- but not data we can provide)
Now that the team understood the data needs and the reports users were using, we created a few concepts for an inventory dashboard

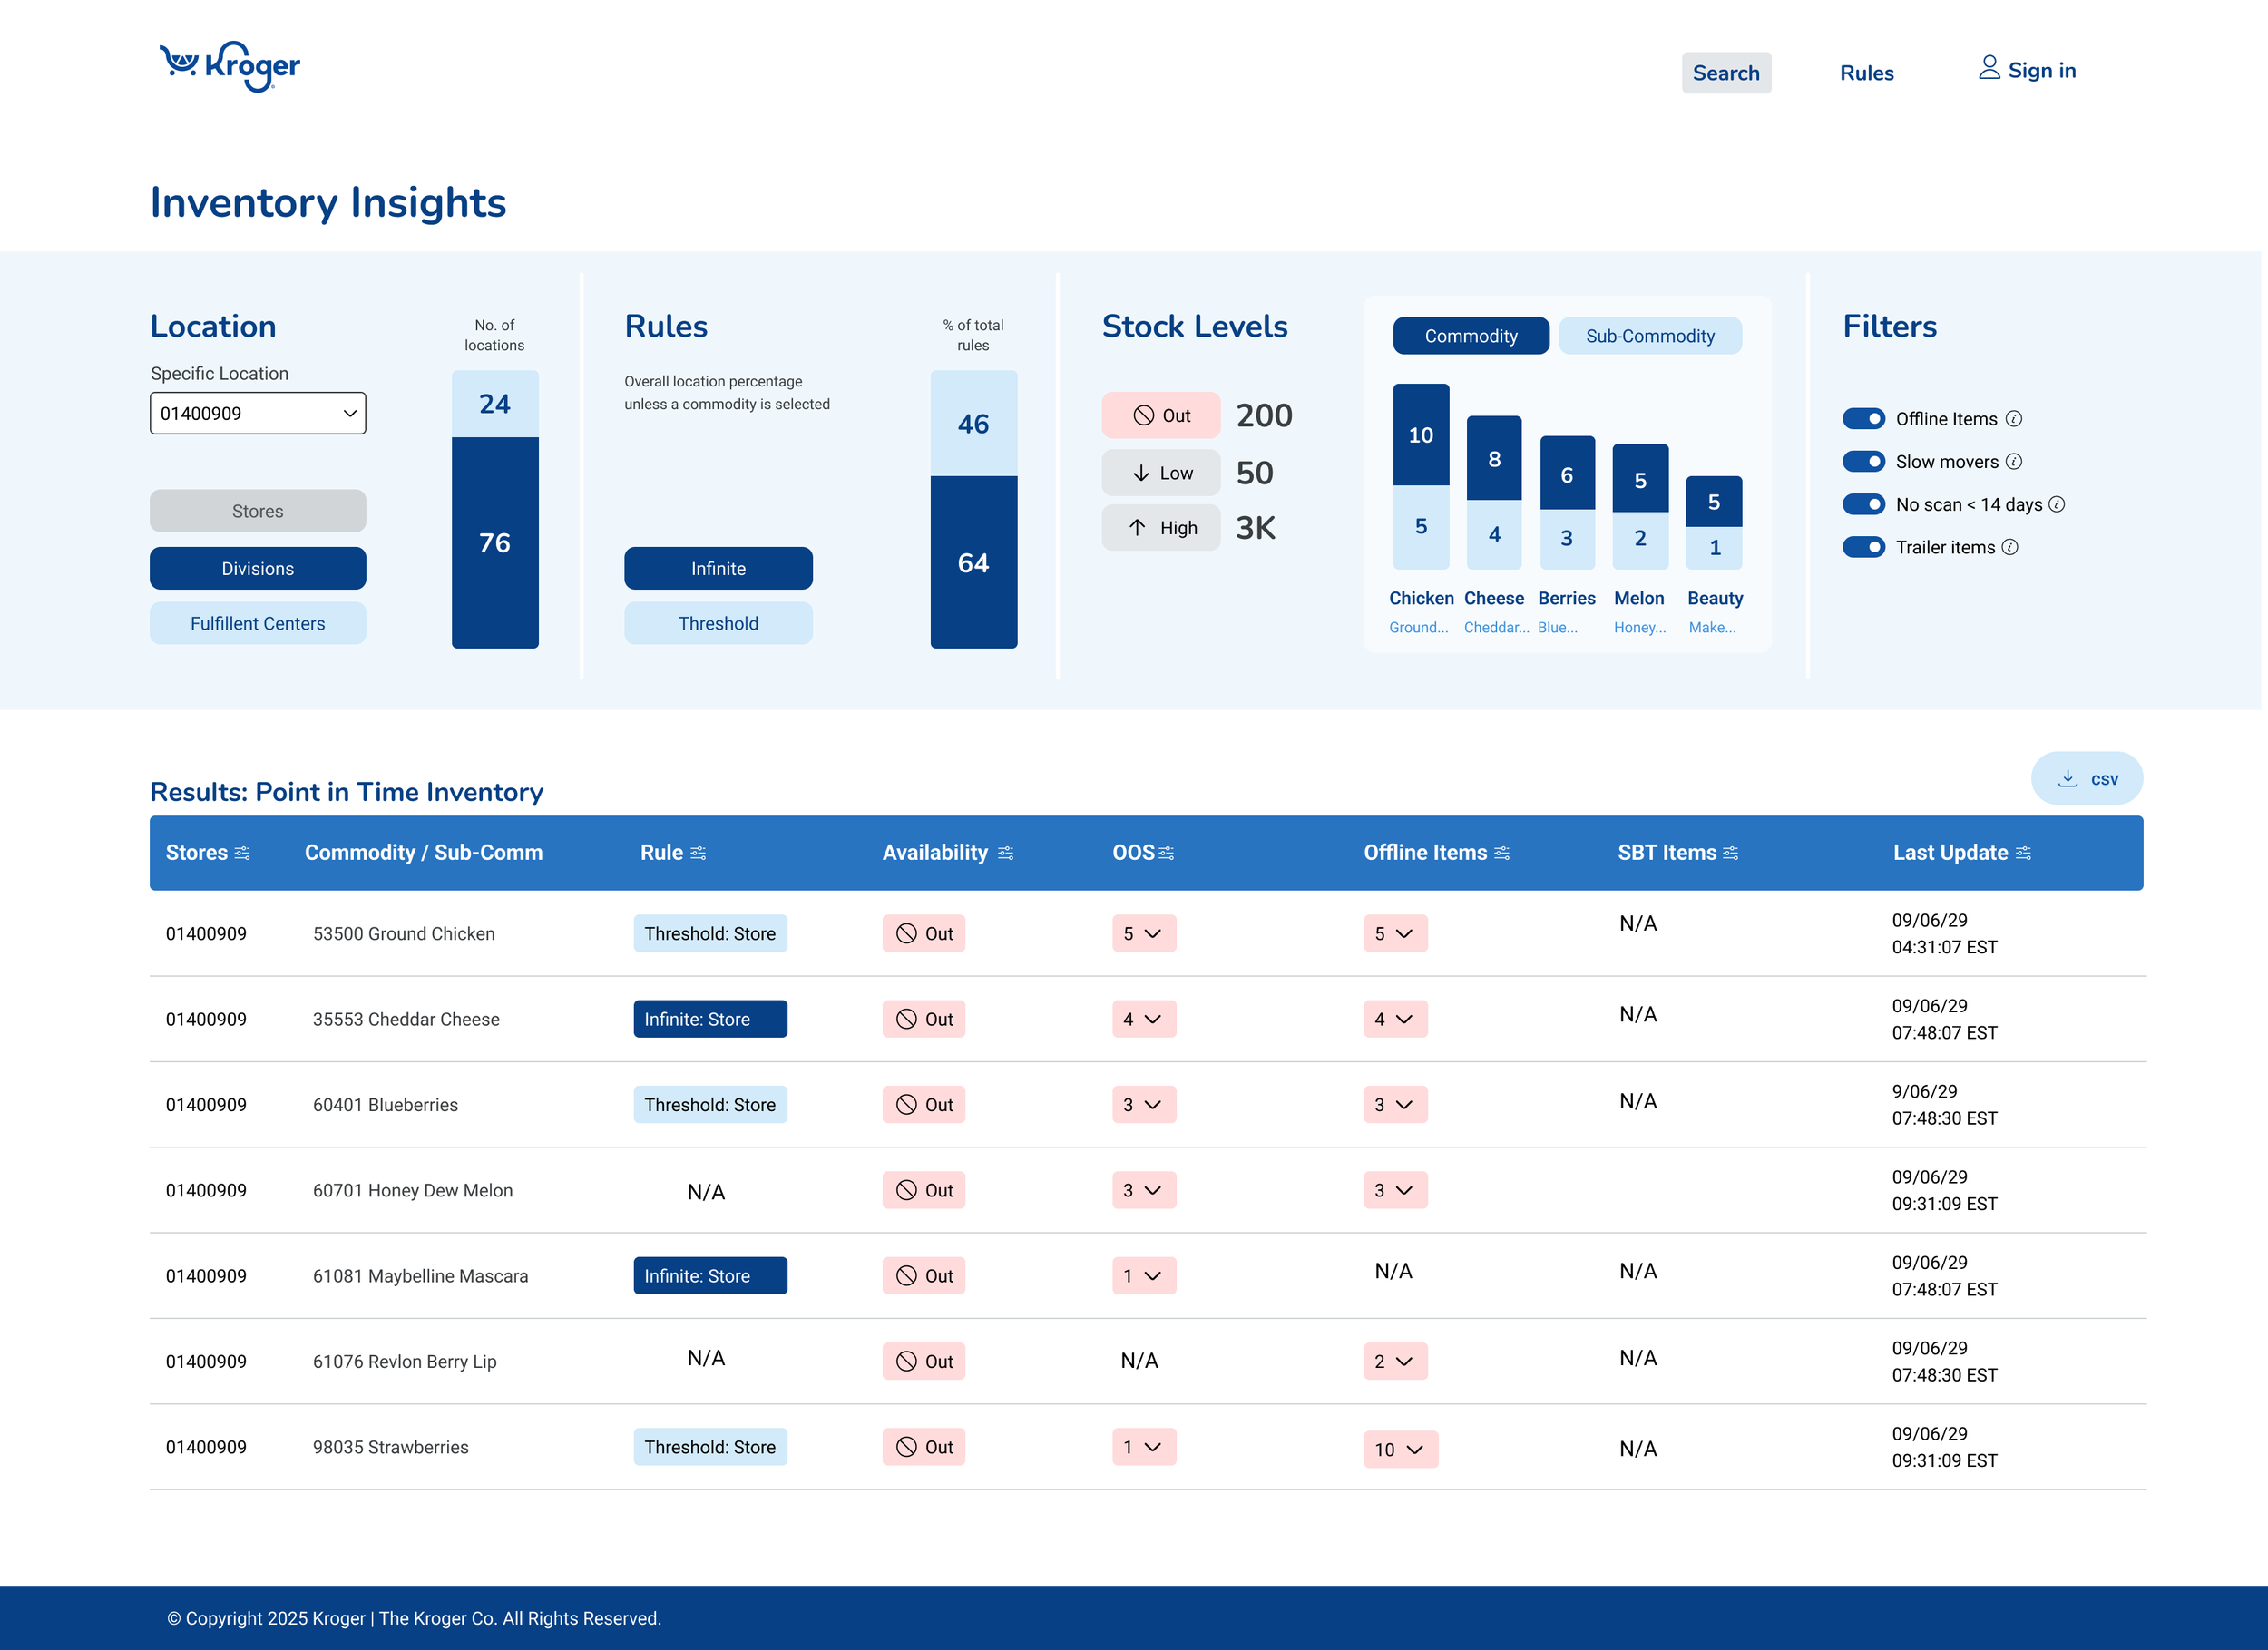
Final Dashboard
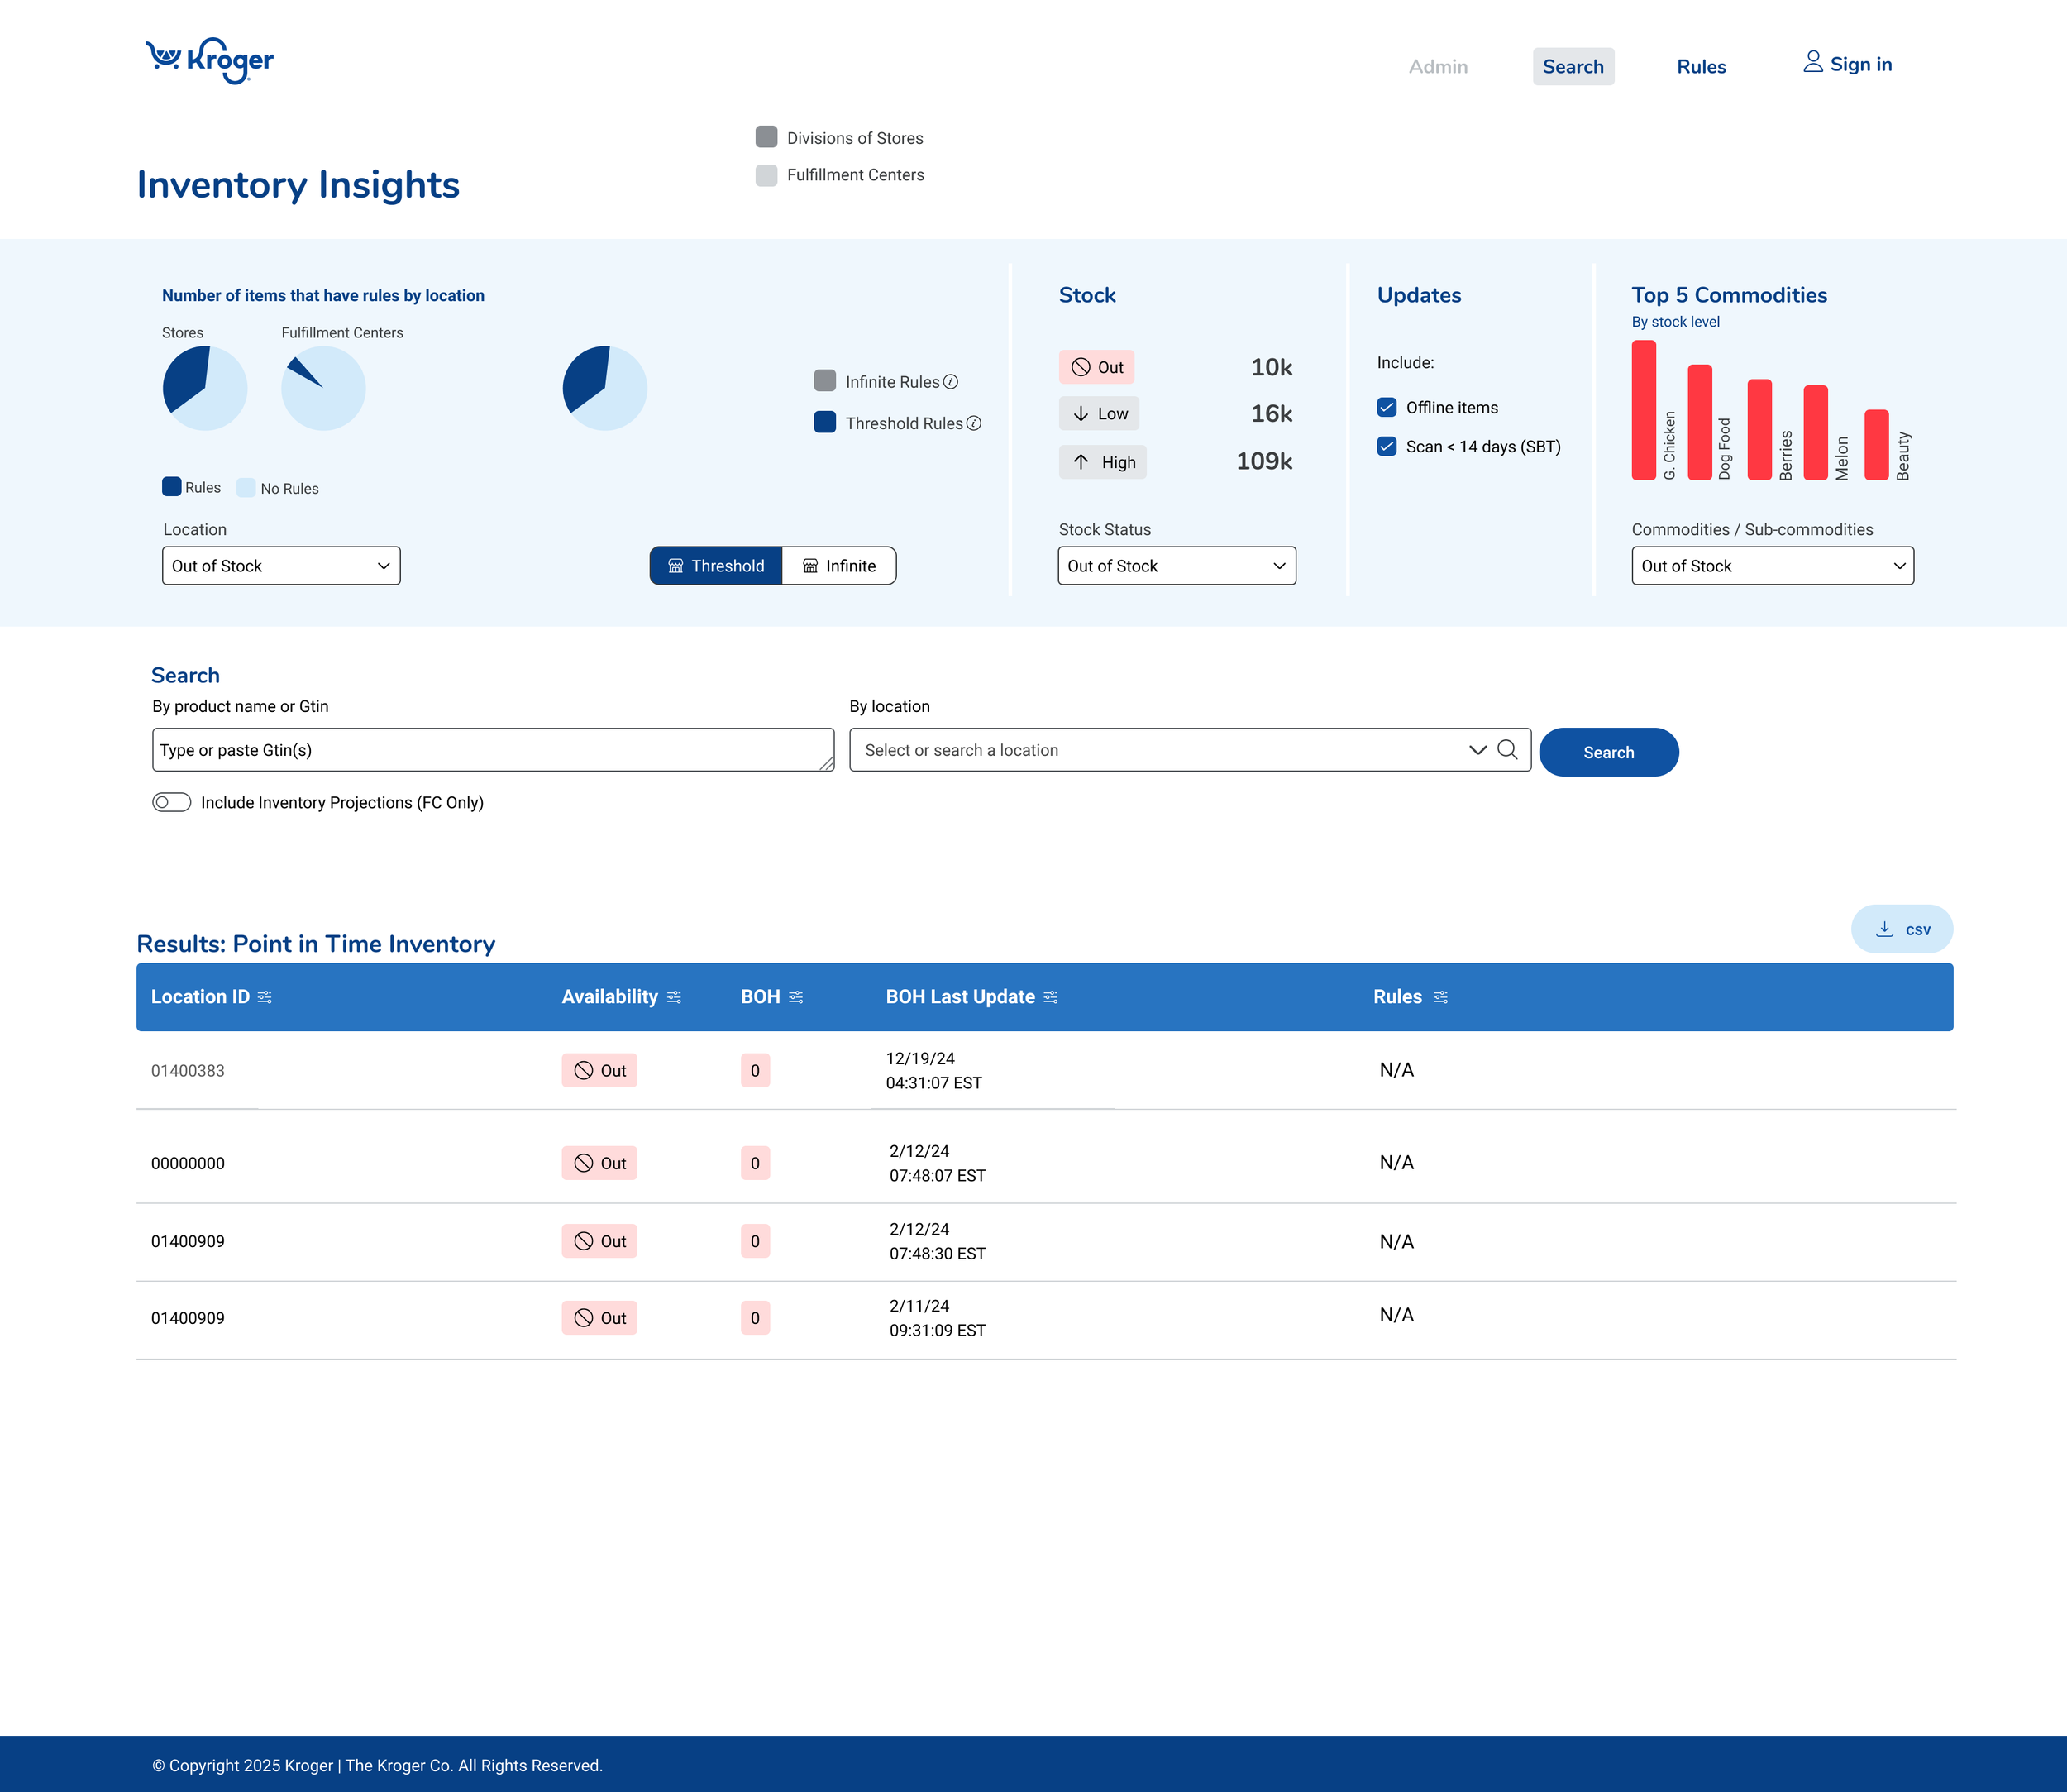
The dashboard is clean and functional
The buttons, dropdown and filter can sort and slice the data with the results displaying underneath.
With no selections or filters, it shows an enterprise view. As you add filters and selections, it gets more specific so that a user can investigate why something is showing out of stock
The filters on the right show things that affect buyability that are outside of the inventory team and can be turned off or on to pinpoint inventory issues
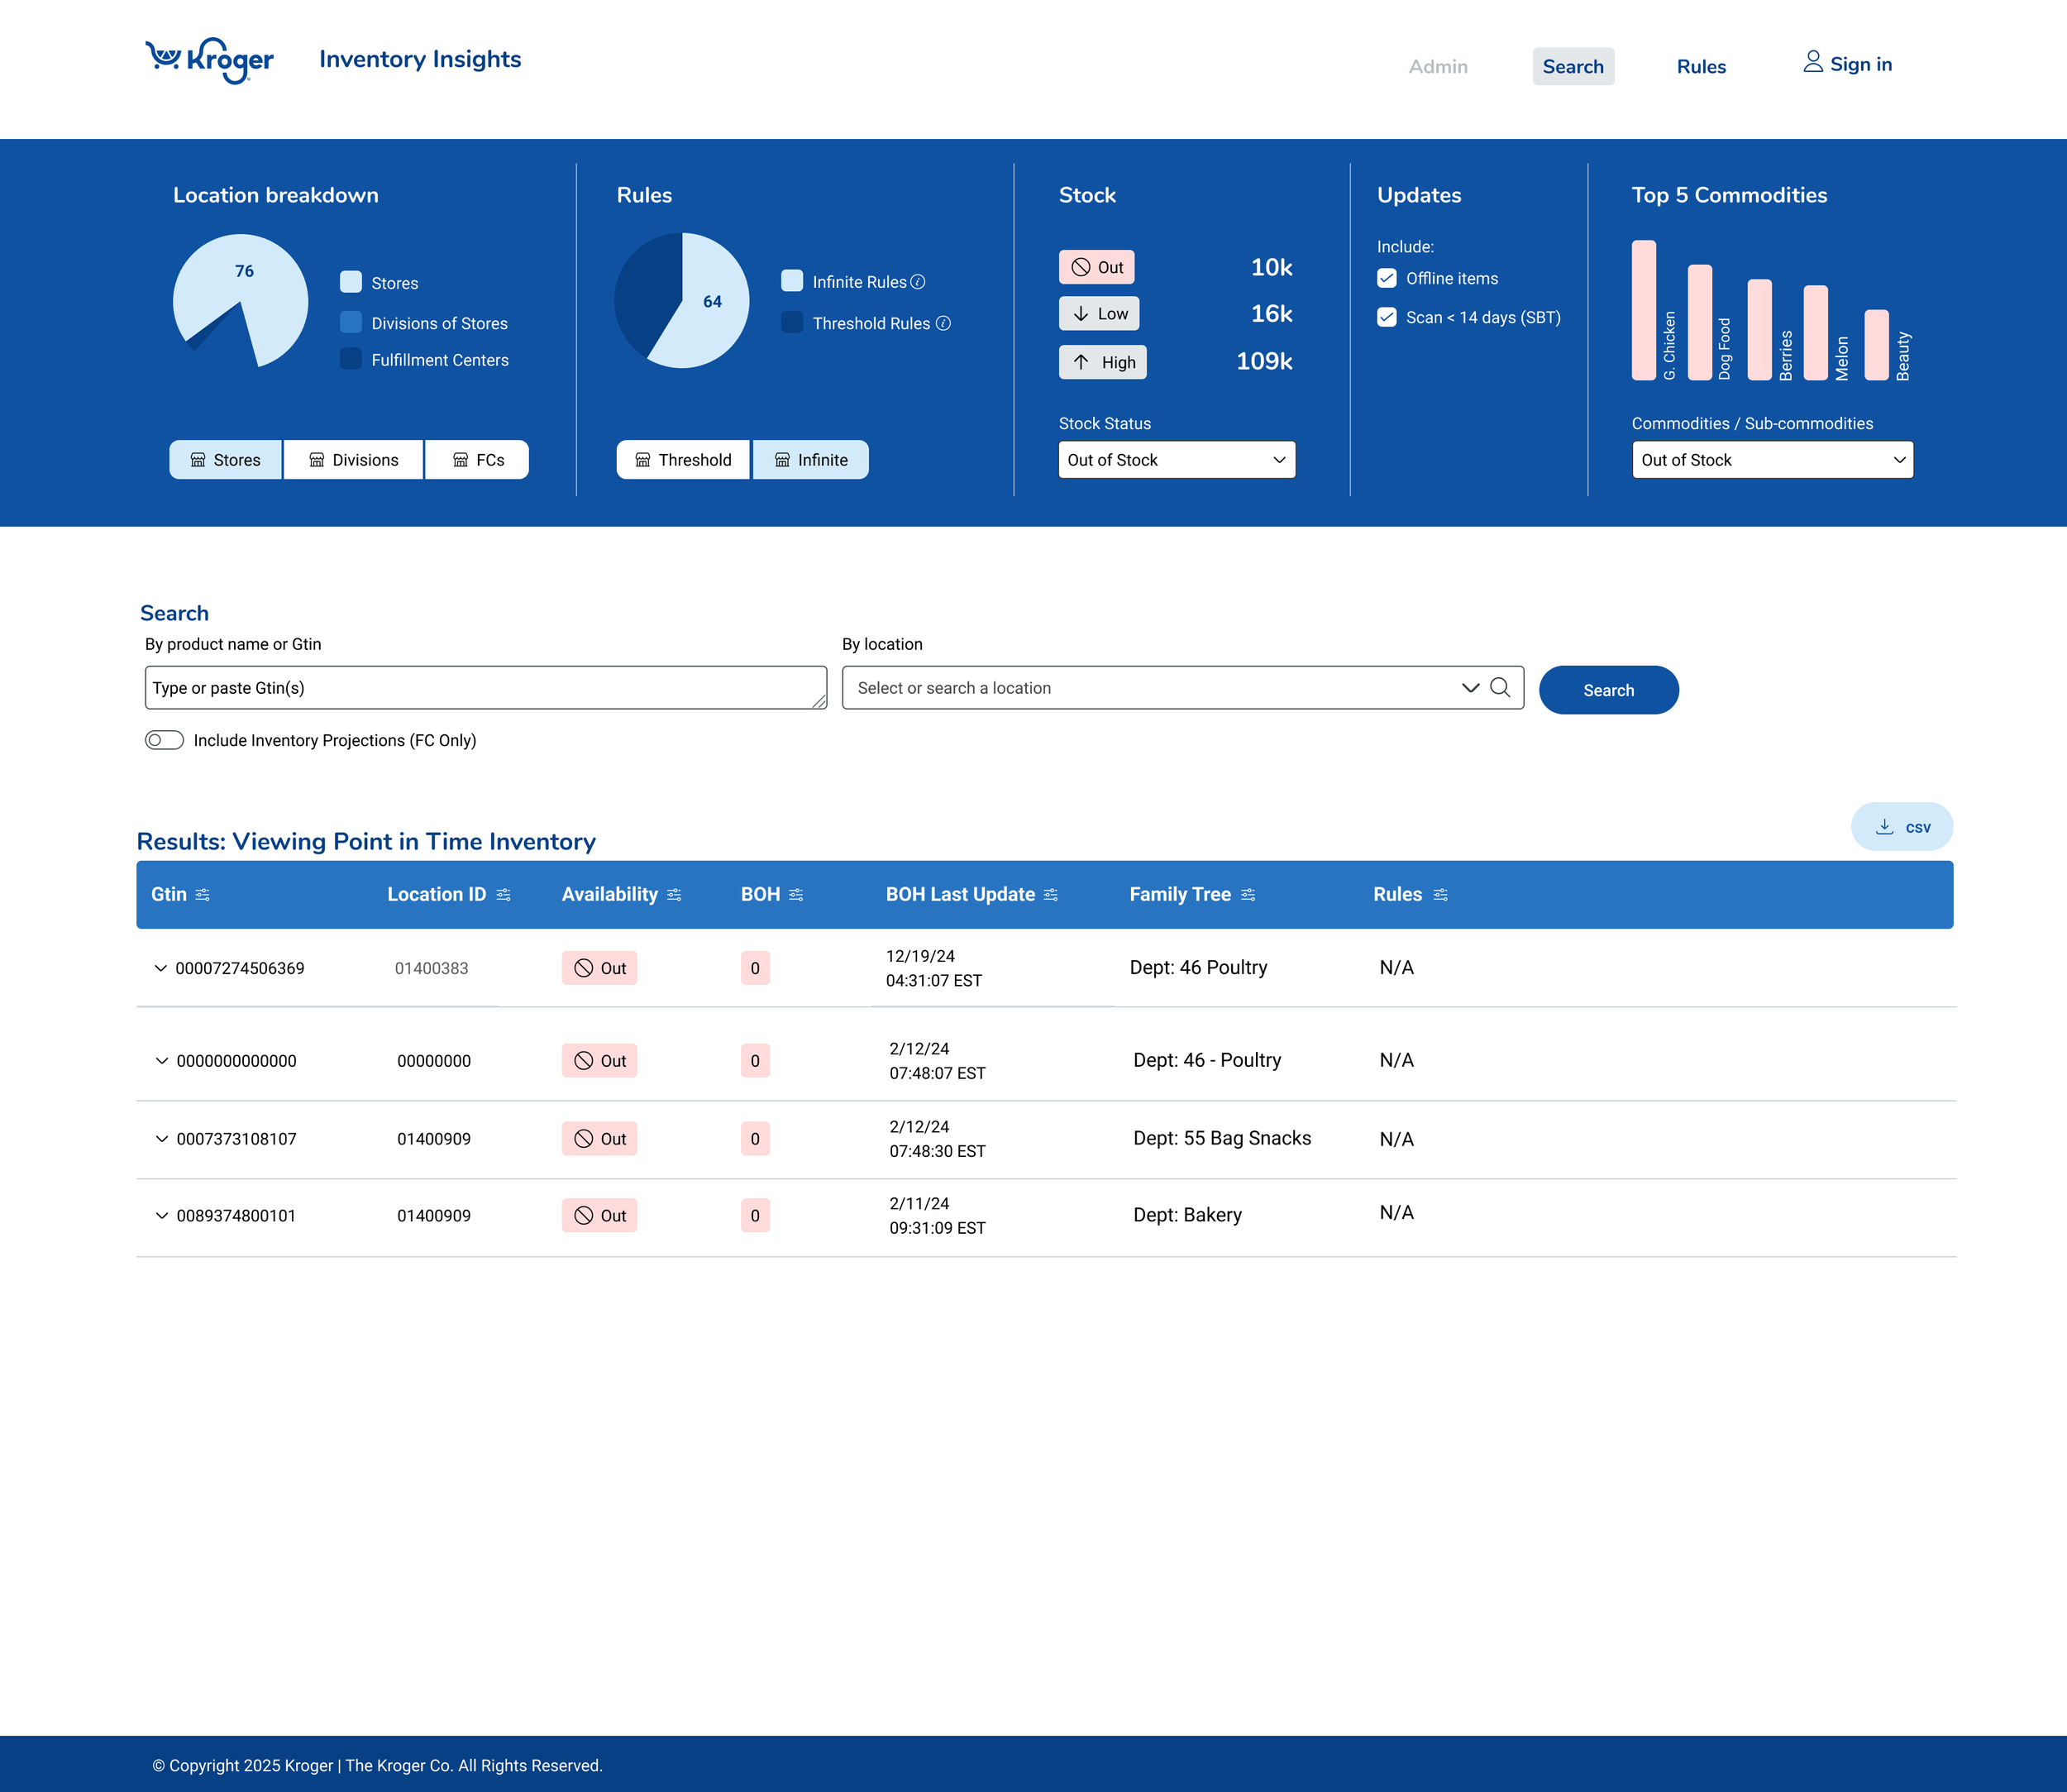
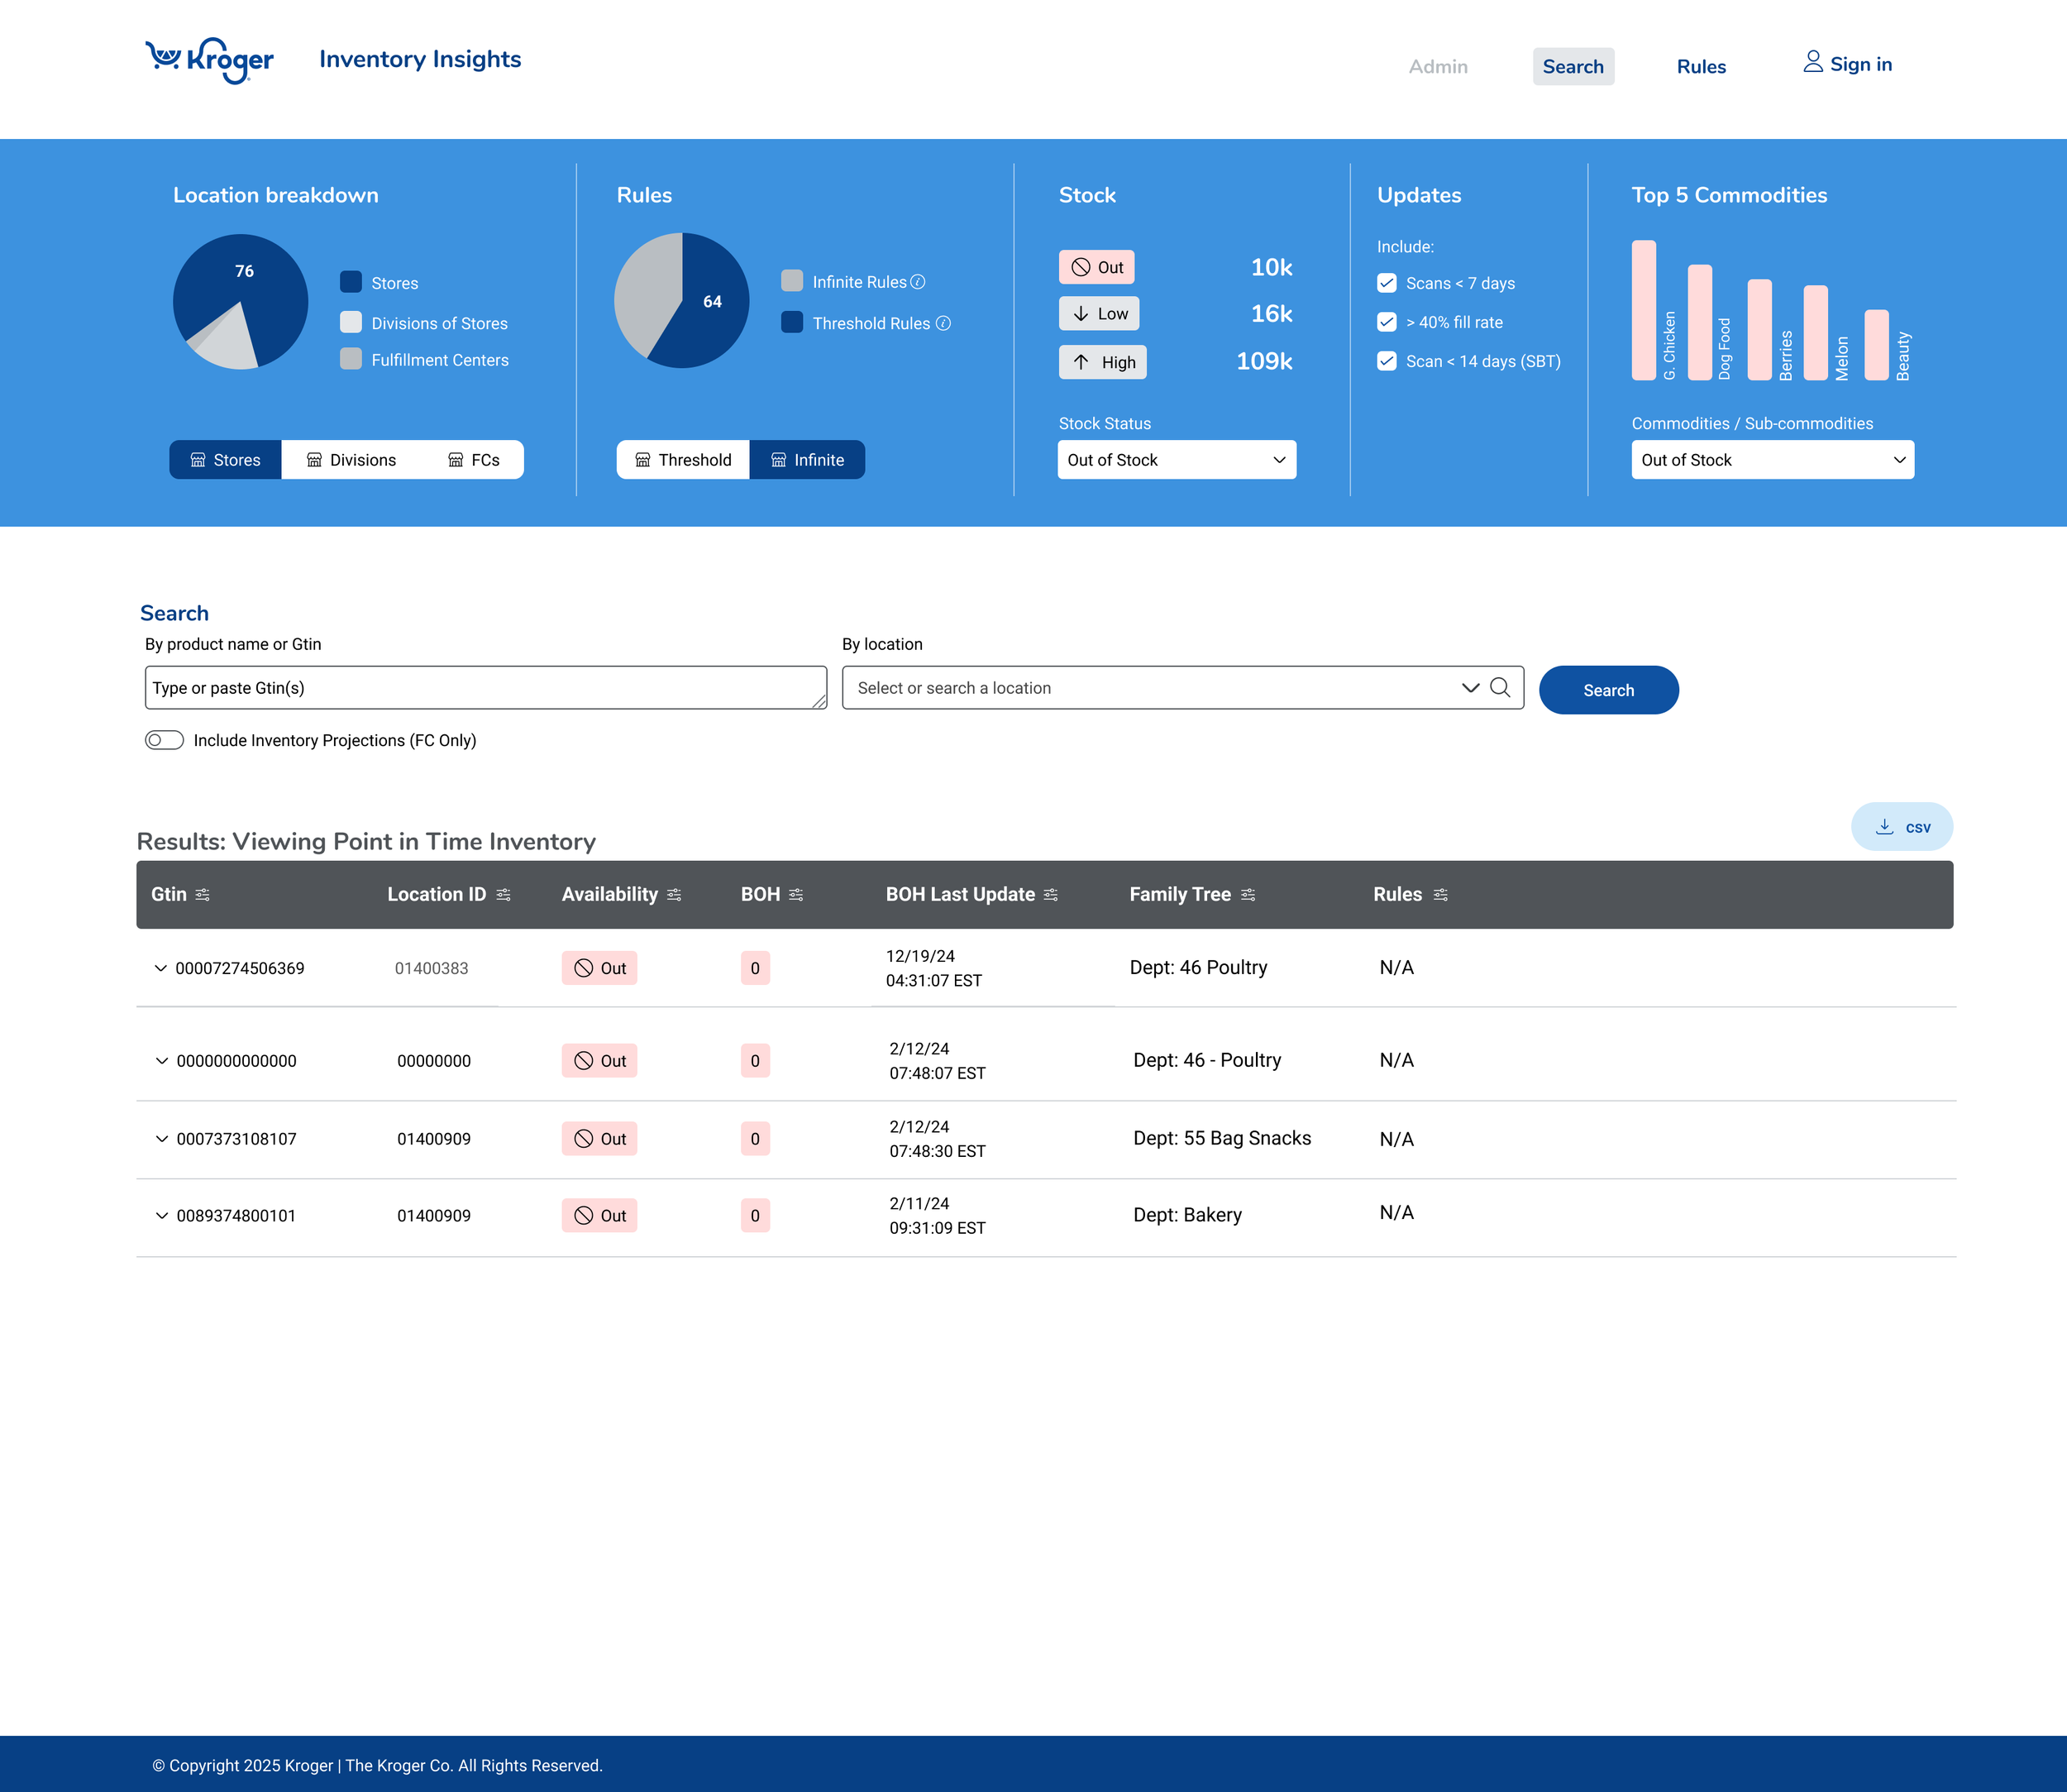
Prototype of previous iteration shows how the dashboard narrows from a large, enterprise level to a single location and sub-commodity.
Conclusion
Inventory Insights started out as an application only used by engineers and morphed into an user friendly application that has a wide audience of business users. The core values of Inventory Insights are investigation and problem solving, and with each iteration it got more sophisticated from querying to manipulation to proactive reporting.
The product team also grew tremendously from engineering lead to a truly collaborative product trio with all of us working together to bring together desirability, viability and feasibility.