Getting the groceries you ordered!
Client: Kroger Customers
Role: Senior Product Designer and Inventory Expert
Worked with designers in customer experience to discover, define, develop & deliver the experience.
Cross department collaboration between customer experience and supply chain. Collaborated with multiple product managers, product designers, engineers, program managers, stakeholders and design research
Background
Customer experience and supply chain worked together to provide a better inventory experience.
This started with a week long focused workshop to understand our respective product spaces and continued with several discovery sessions, research, testing, iterations and weekly touch point meetings.
This project took over a year to complete and involved many product teams, stakeholders and leadership buy-in to carry-out the combined 3 initiatives:
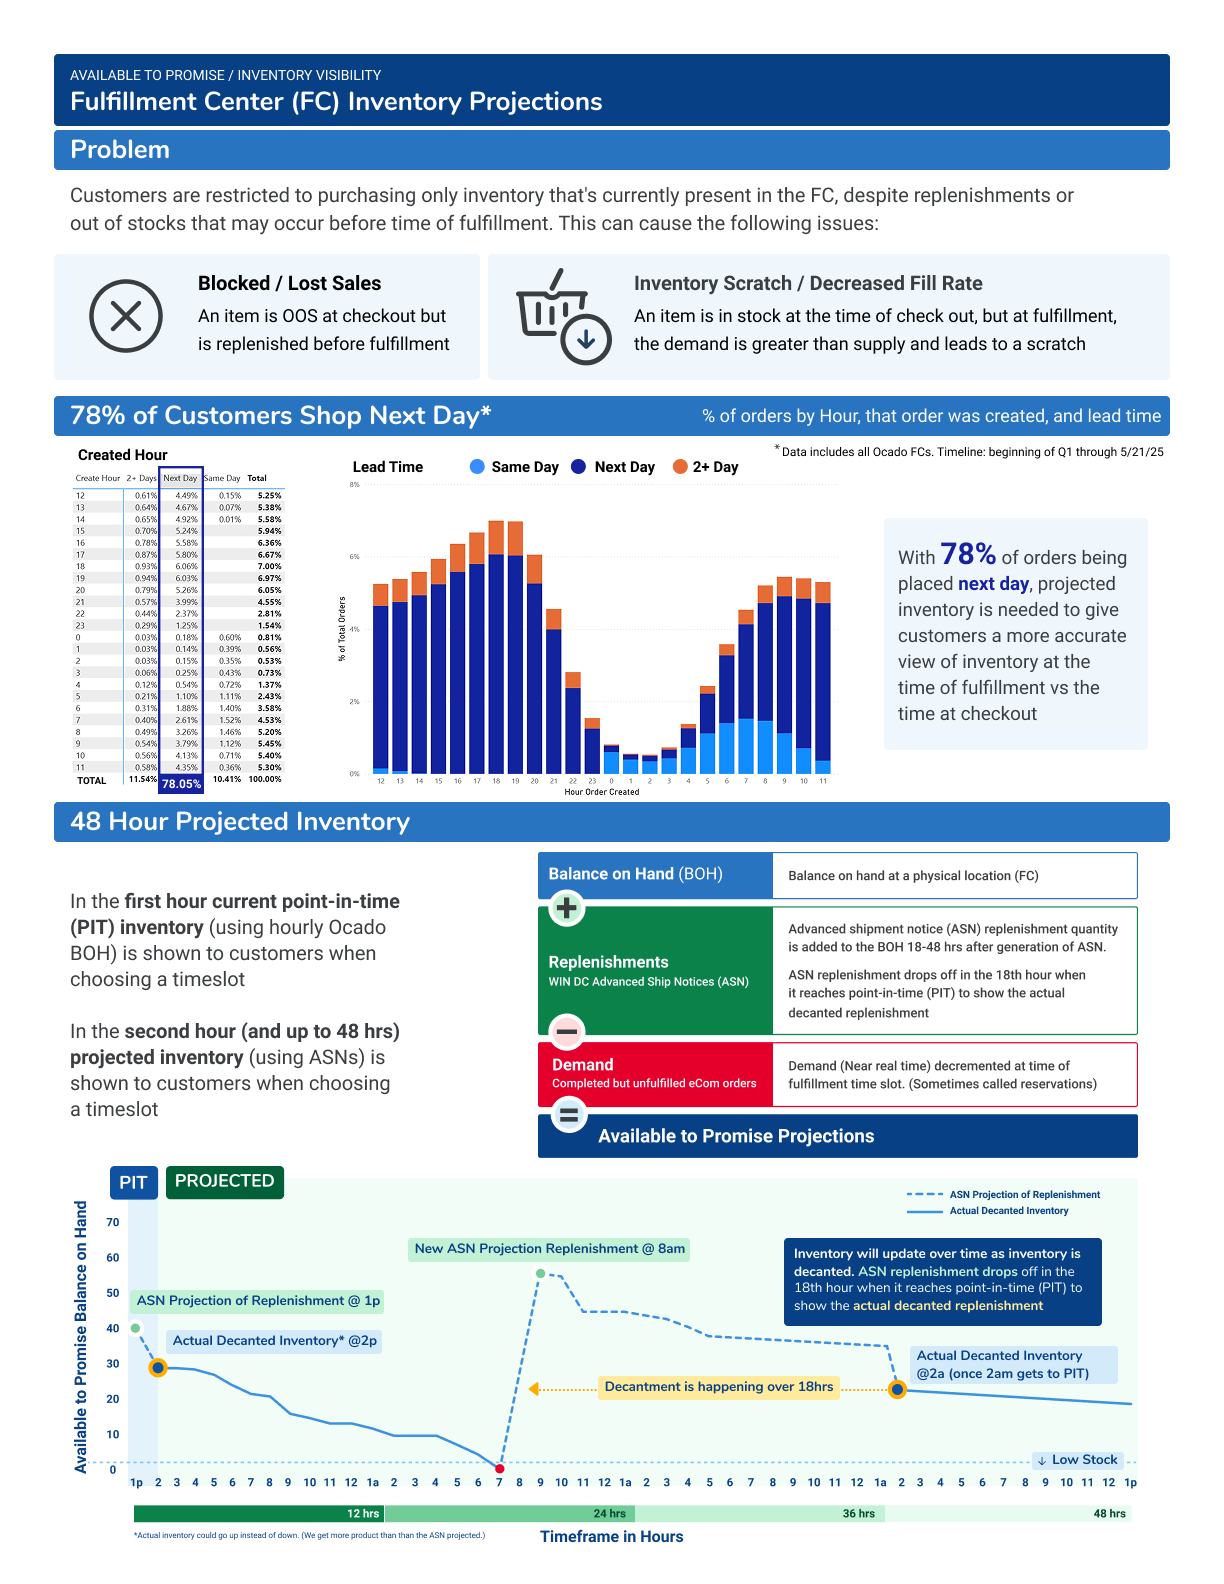
Inventory check at checkout
Item replacement
Projected inventory
Challenges and Risks
There was a concern that business (increased fill rate) was driving the teams to build something that wouldn’t add value to the customer. In fact, there were concerns that adding an inventory check at checkout would cause additional fallout later in the shopping experience causing frustration.
Additionally, there were questions on whether giving a customer an option to replace an item that was unavailable would cause the customer to abandon their cart because of the additional effort to replace an unavailable item.
With projected inventory, there was always a concern of accuracy. Blocking sales because the projection is inaccurate.
Workshop 1 Goals
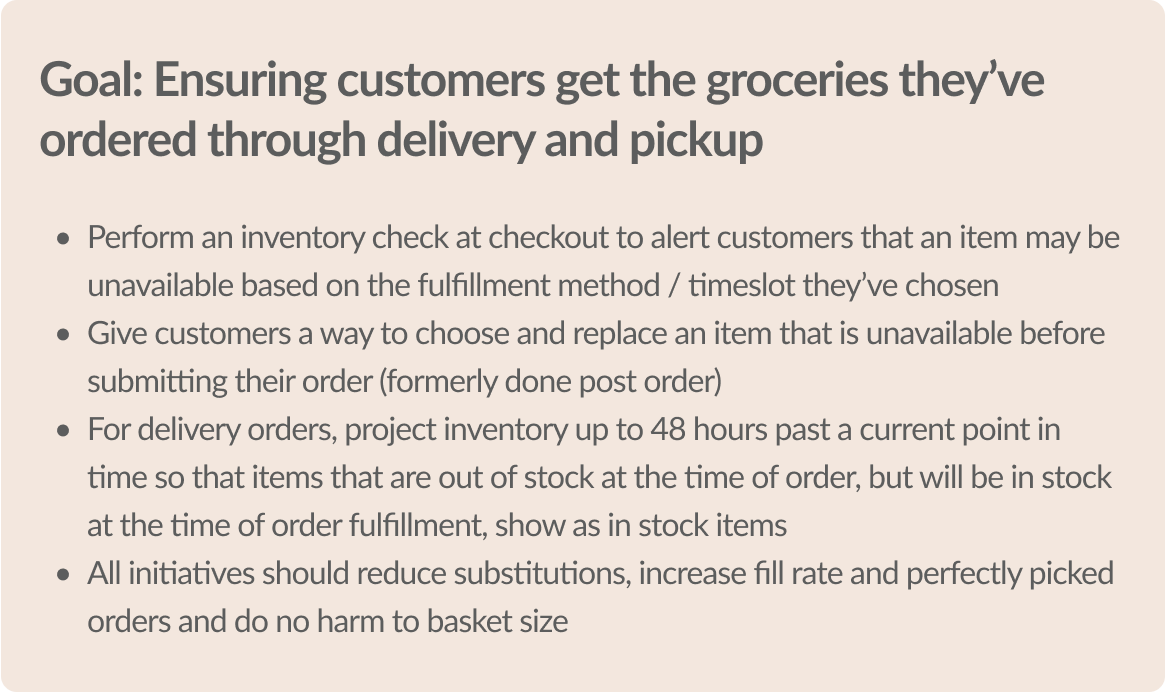
Focus on instilling trust in, and accuracy of Kroger inventory so that customers have confidence they will receive the items they ordered
Share service blueprints and goals of each area
Identify pain points and opportunities
Brainstorm ideas and experiments
Inventory service blueprint with pain points from both customers and the business side. Created and presented by me.
Everyone’s early ideas written down on stickies
Break out groups: Group 1 brainstorm ideas
Notifications of back in stock during & after shopping journey
Break out groups: Group 2 brainstorm ideas
Multiple ideas / paths
Break out groups: Group 3 brainstorm ideas
No dead ends - multi fulfillment methods
Opportunity tree (Theresa Torres) showing our expected outcome of transparency, opportunities and possible solutions
List of experiments and studies needed to test possible solutions
We mapped the experiments we wanted to perform based on the impact and difficulty to determine priorities
Final list of experiments
Point in time (POT) inventory check at checkout.
Review of metrics to see how much fallout would occur by doing an inventory check at checkout. (Led by product management)
Allow customers to choose a backup / replacement item. (Led by product design, design research, and product management)
Inventory research for current and future state
Two rounds of usability testing
A/B testing for item replacement experience
Available to Promise (projected inventory) at checkout. (Led by design research and product design)
Interviews with customers to understand their needs around inventory
Concept testing of projected inventory mockups to get customers’ feedback
Workshop 2 Goals- Item Replacement Focus
Goal: How might we eliminate dead-ends in checkout & ensure that the experience is easy to use?
Design methods and Luma exercises to define the item replacement experience: (Workshop led by me)
Reviewed metrics for substitutions and back up items, time customers spent shopping and various inventory numbers
Competitive analysis (3 shown here). Rose , bud, thorn analysis
Pulled secondary and past primary research
Created storyboards
Rough & Ready Prototyping
Voting
Competitive analysis and rose, bud and thorn exercise
Amazon competitive analysis
Walmart competitive analysis: Most informative
Target competitive analysis
Secondary research: past research and Baynard research
Word cloud of previous research: Customer’s biggest challenges
Previous customer research that talks about wanting to pick their own item for substitution
Research from Baymard Institute related to inventory
Storyboards to help the team get into the mindset of the customer and understand the context surrounding the experience
Wireframes to conceptualize the experience and voting to determine the direction we should take for mockups and testing
By the end of workshop 2, we had a general experience direction to test with customers:
We knew that we wanted to notify customers that there was an unavailable item and for them to replace the item from the scheduler page
However, we needed to test a few options, based on the above wireframes, using higher fidelity Kroger stylized mockups
Workshop 3 Goals: Map our assumptions
Along with testing our wireframes, we wanted to test our assumptions that were both customer facing and internal feasibility questions.
(Helped lead workshop)
We wrote down assumptions that we had about the initiative, identified the riskiest assumptions, categorized them and discussed how we could test them
We categorized our assumptions by desirability, feasibility, viability, ethical and usability
This helped us build a list of questions and test scenarios with our usability tests.
Research: General Inventory and Projected Inventory Research
Goal: Gather customer sentiment around the inventory experience for both our current experience and future iterations. Gain a better understanding of how inventory impacts the customer’s shopping journey and what decisions they are making as they are building their order.
Moderated virtual interview sessions and concept testing with 5 customers.
(Partnered with design research and CX product designers to write questions and conduct interviews. Interviewed participants and presented findings.)
Asked inventory questions to understand customer needs and preferences for out of stock items
Item replacement desirability study and experience feedback
Projected inventory desirability study and experience feedback
Affinity mapping of interview data
Projected inventory experience test
The interview started with asking the customer to think about an item they really like or buy often.
The screen below is showing the product card results from a search and the gray box represents the item that they like or need. We didn’t use a specific item because everyone has different needs / likes and the item that we chose, may not be important to them. We needed to create a sense of urgency for this item and find out what customers would do if they saw the ‘Back in Stock March 8th’ message. Would they pause their order and come back when the item is back in stock? Would they pick it up at their local store etc?
Initial findings, insights and HMW questions
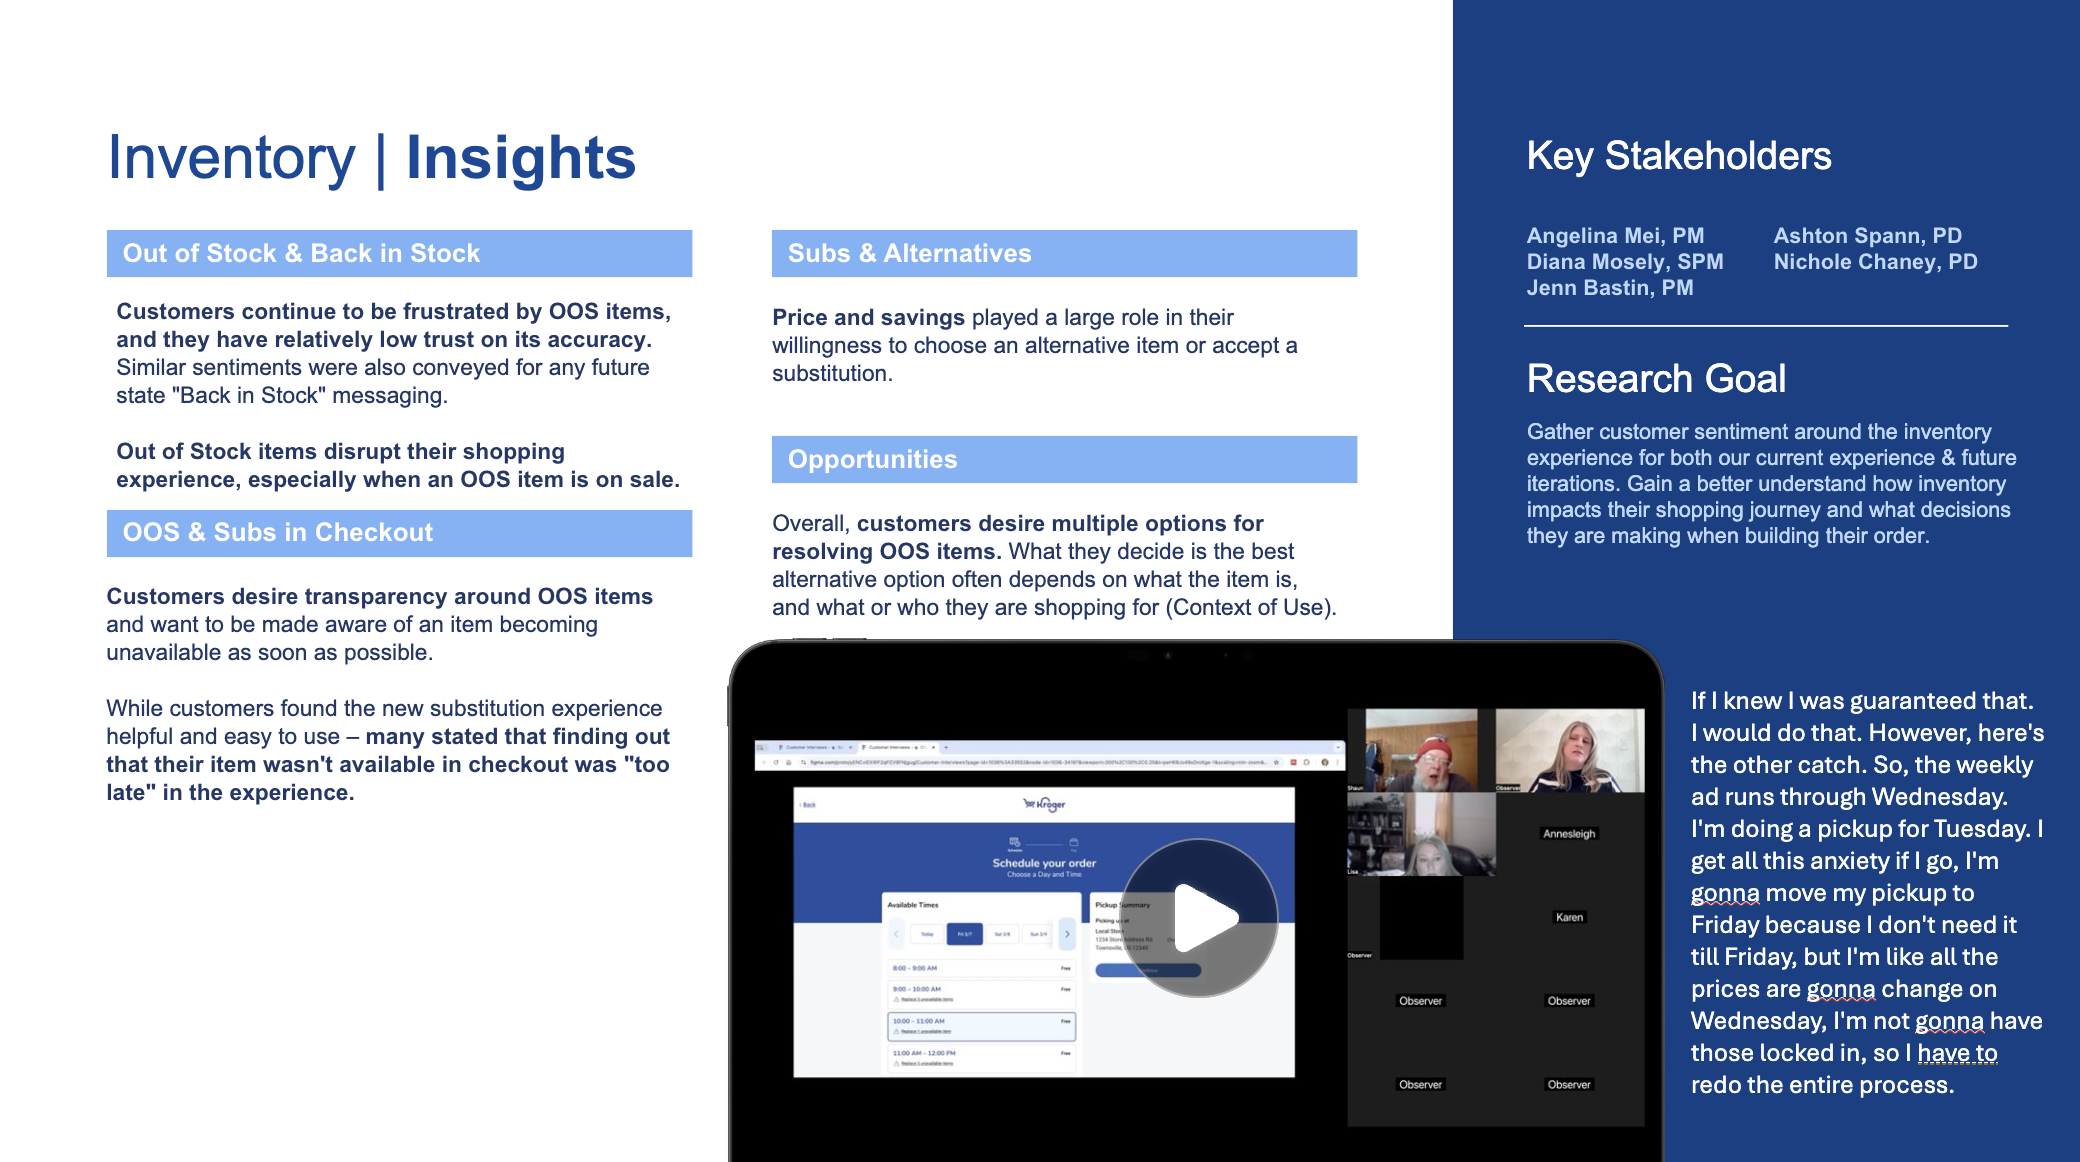
*Sorry, video does not play here due to confidentiality
Research Conclusions
Currently checkout is the place where most customers chooses a fulfillment method (pickup, Kroger delivery, Instacart delivery) and a timeslot; so in the current experience it is not possible to show customers out of stocks sooner. However, we are continuing to iterate to try and get customers to choose the fulfillment and time earlier in the shopping journey.
According to the test, projections should not be used on the product cards because customers do not trust the message of when it will be back in stock.
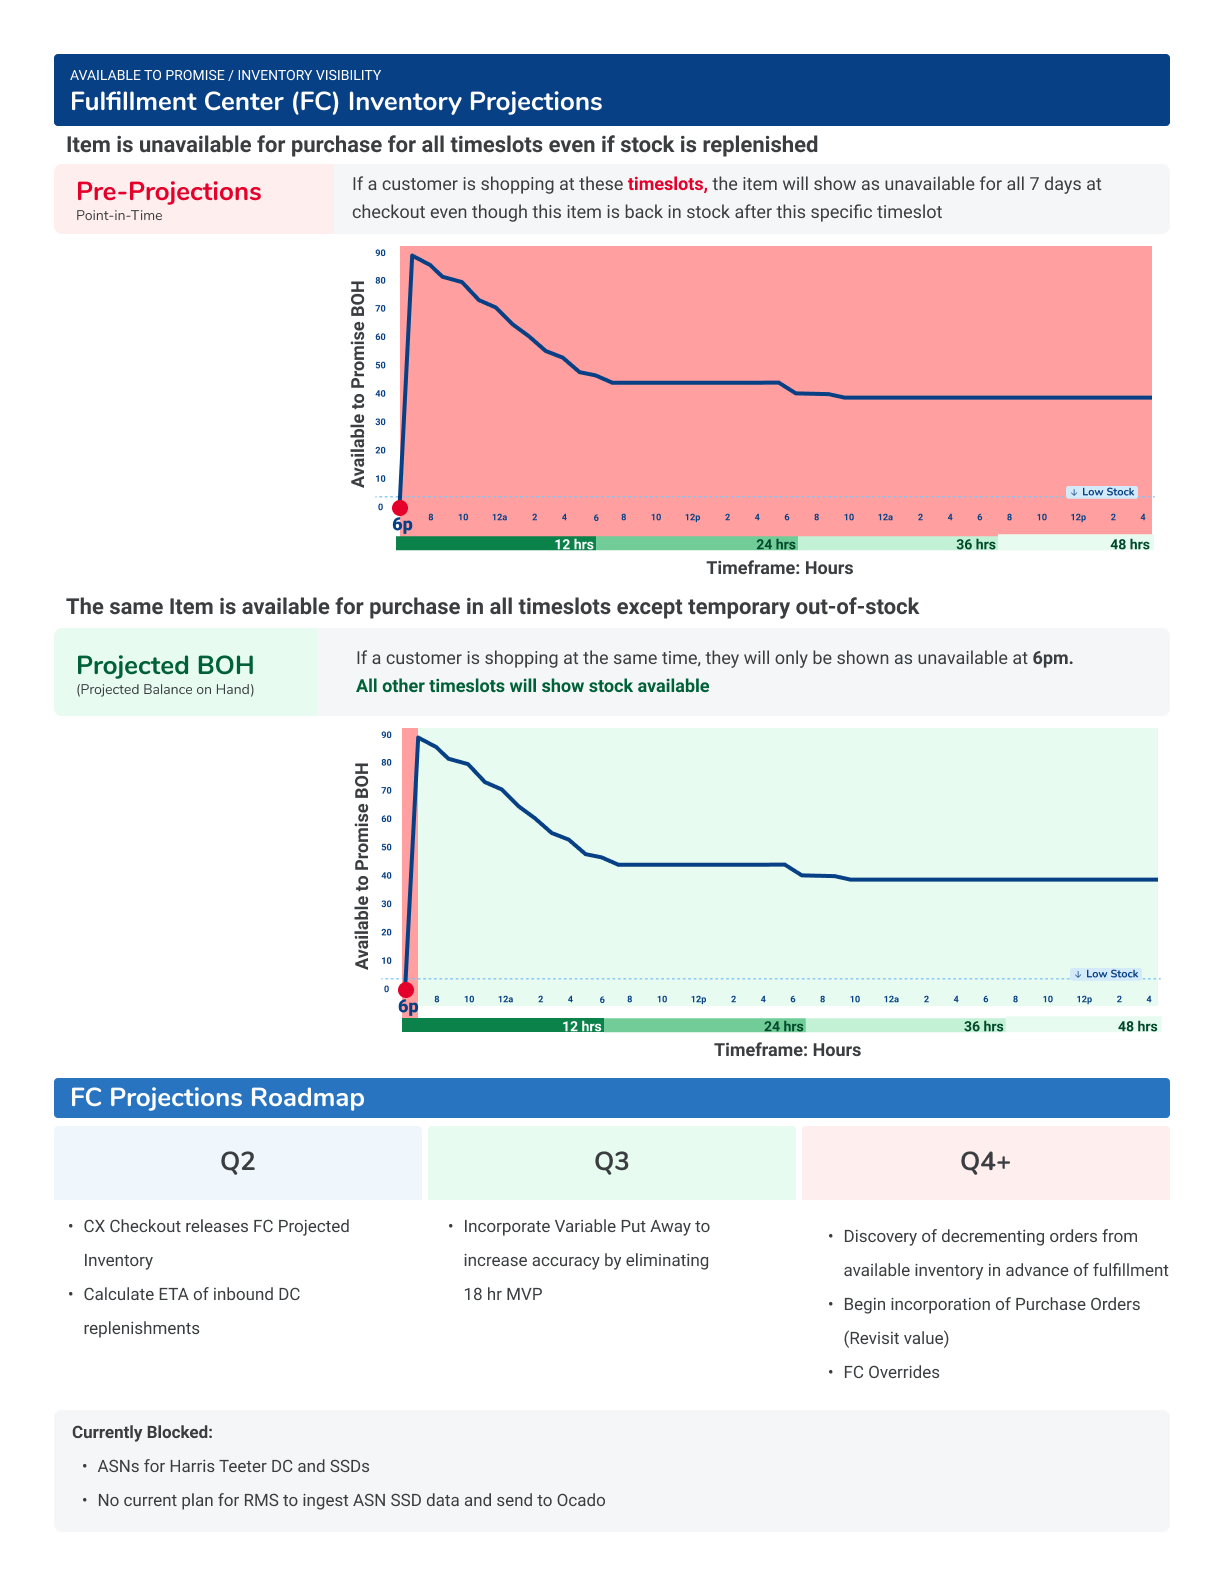
It was decided that it was best to have projected inventory in the background for Kroger delivery orders. An item would show as in stock if an item was currently out of stock, but was being replenished at the time of fulfillment. Vice versa for orders that were in stock at the time of ordering but would be out of stock, due to demand, at the time of fulfillment.
Designing / Testing the Item Replacement Experience
The item replacement experience was built using:
The Kroger Design System Library
Layout templates from scheduler, product cards, and ‘choose a backup’ in cart
New portions of the experience included being able to view ‘unavailable items’ in scheduler, the replacement flow and the entrance / exits into the experience.
(Collaborated with CX designer to build the new experience. Led the usability testing.)
Usability Testing
Top items to test:
Entry / Exit into experience
Does this benefit the customer?
Customer sentiment
Ease of replacing items
(Engagement /How often would it be used? Later in A/ B testing)
Unmoderated testing of 3 prototypes using Userzoom
Screening for customers who do the majority of the shopping and are Kroger customers
Two tests
1st test- 10 Kroger customers
2nd test- 4 Kroger customers
Usability Test Results from the 2nd Test

Top Findings
1st test: We were on the right path of replacing / removing items, but specific tasks needed to be simplified
Customers were confused with replacing a quantity of 1- 1% gallon milk with a quantity of 2- 1% 1/2 gallon milk. Therefore, in the 2nd test, we had customers. replace a 1 gallon 1% Kroger branded milk with a different brand of 1% gallon milk
There were some technical glitches with the pop-up drawer. We fixed the issue to make the transition seamless.
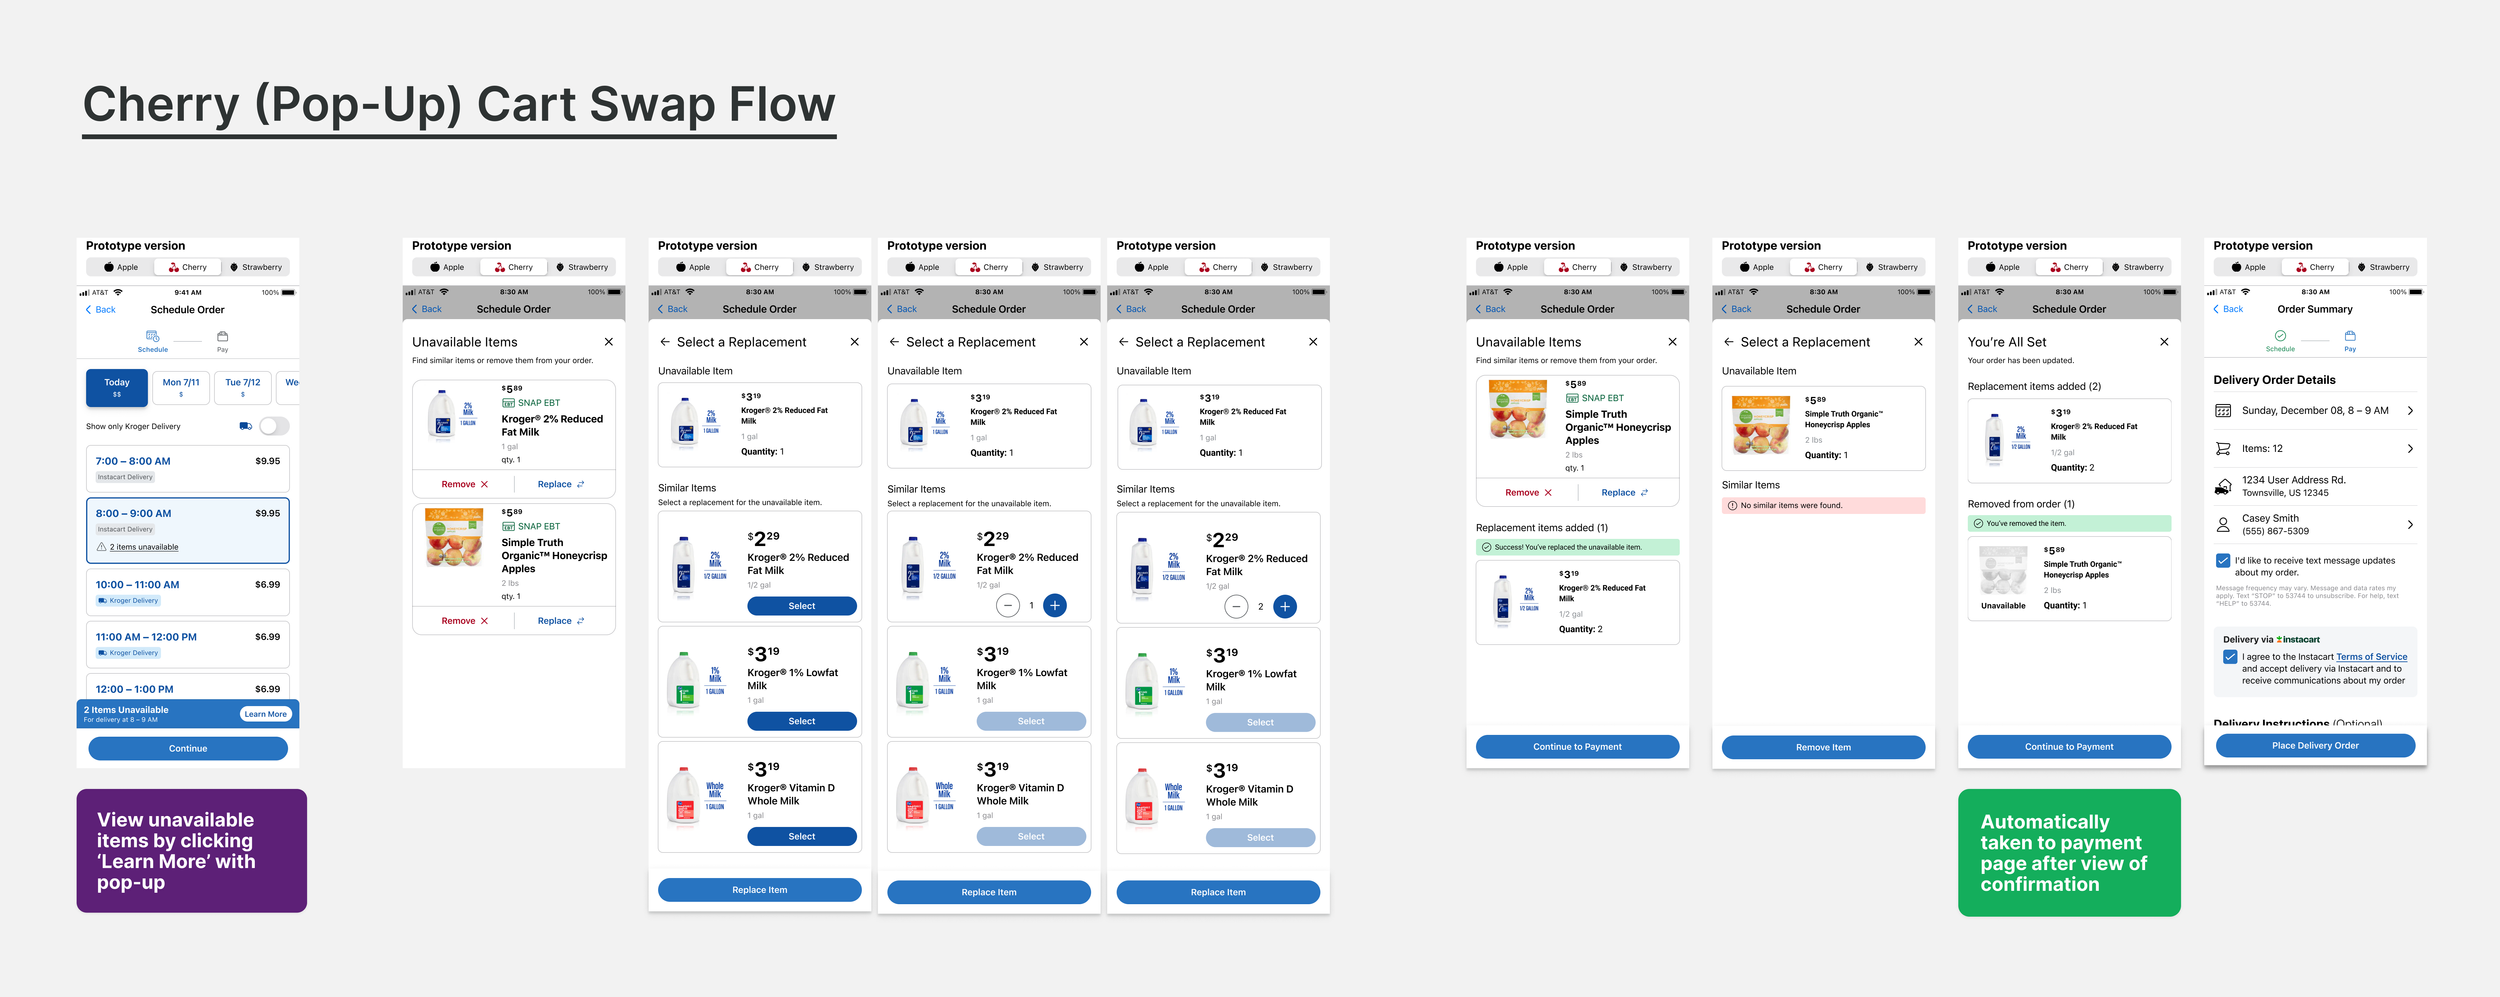
2nd Test: Participant Success! It's easy to replace / remove items
Customers liked the pop-up drawer the best (cherry); however, it was decided to go forward with the ‘Unavailable Items link’ for MVP because it was straight-forward technically
Customers did find value in replacing an unavailable item!
Item Replacement Experience Iterations
Iterations & minor revisions were completed to ensure a seamless and consistent experience across the shopping journey
Desk checks were conducted with other designers and engineers to ensure a consistent experience
Added the date / time within the item replacement experience to remind the customer of the day / timeslot that was chosen
Copy update for when there is not a similar item:
From: ‘There was a problem retrieving similar items. Please try again.’
To: ‘No similar items were found. Please try a different time to check items' availability.”
Removed ‘black & white’ stylized images when product was unavailable and needed to be replaced
‘qty’ to Quantity
Line was extended across product card
Snap EBT was added to all product cards
Accessibility check and guidance for developers with accessibility tagging
Final item replacement experience. (Happy path for iOS / desktop).
iOS Happy Path
Desktop Happy Path
Conclusion
There was some risk involved with this project because the ideal situation is to never have unavailable items and to keep checkout as simple as possible. Our team will continuously improve the experience and increase availability of all products. Meanwhile, item replacement is a way for customers to get out of a dead end and get an item that is needed.
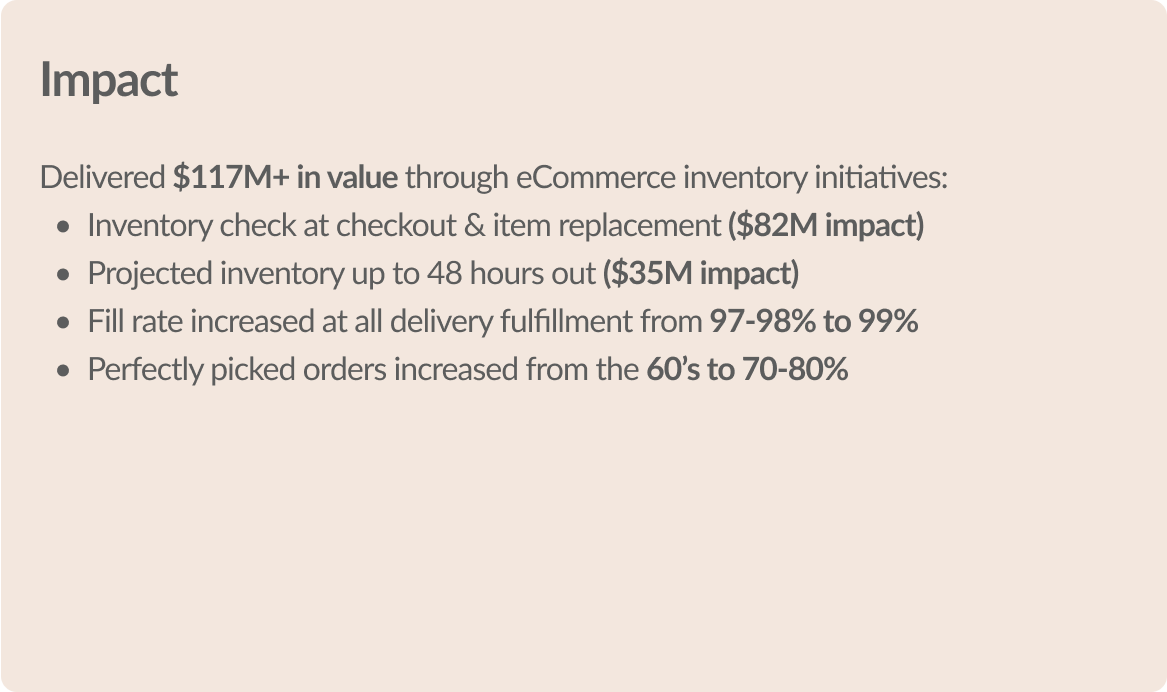
All 3 of these initiatives were rolled out individually after separate A/B testings showed the following:
30% overall engagement rate
Pickup
+9.4% lift in cart adds and +8.7% lift in orders placed within the new experience - both reaching statistical significance
Delivery
Order revenue: Around a +25% lift
Orders and cart adds originating directly from the fallout recovery experience increased by +4% and +1%, respectively
Delivery Customer UserTesting Survey: “I can get all items in my order” ranked highest consistently from Q2 2022 through Q2 2025